Presentations
Selected presentations and data decks, interactive on desktop. Becoming Engineers (Sep 2026) in two parts, Hong Kong ListCo Value Creation Analytics, and All That Glisters.
Presentations
Selected presentations and data decks, interactive on desktop. Most carry a PDF for reading on mobile.
Keynote · September 2026
Becoming Engineers (Sep 2026) — Part 1
Nine months and forty billion tokens of working with agents, told as a confidence curve: twenty-seven lessons from the command line to systems thinking, and what each one cost to learn. With Chau Woeste on how everybody else makes the same journey.
Keynote · September 2026
Becoming Engineers (Sep 2026) — Part 2, In practice
A practical guide to the working setup: agents and their tools, context budgets, skills and vaults. Twenty-two full-screen panels support a 25-minute session, including a live orchestrator demonstration. Graph engineering is named as the next step, and the session closes with four levels of homework.

Inside the deck
 Slide 14
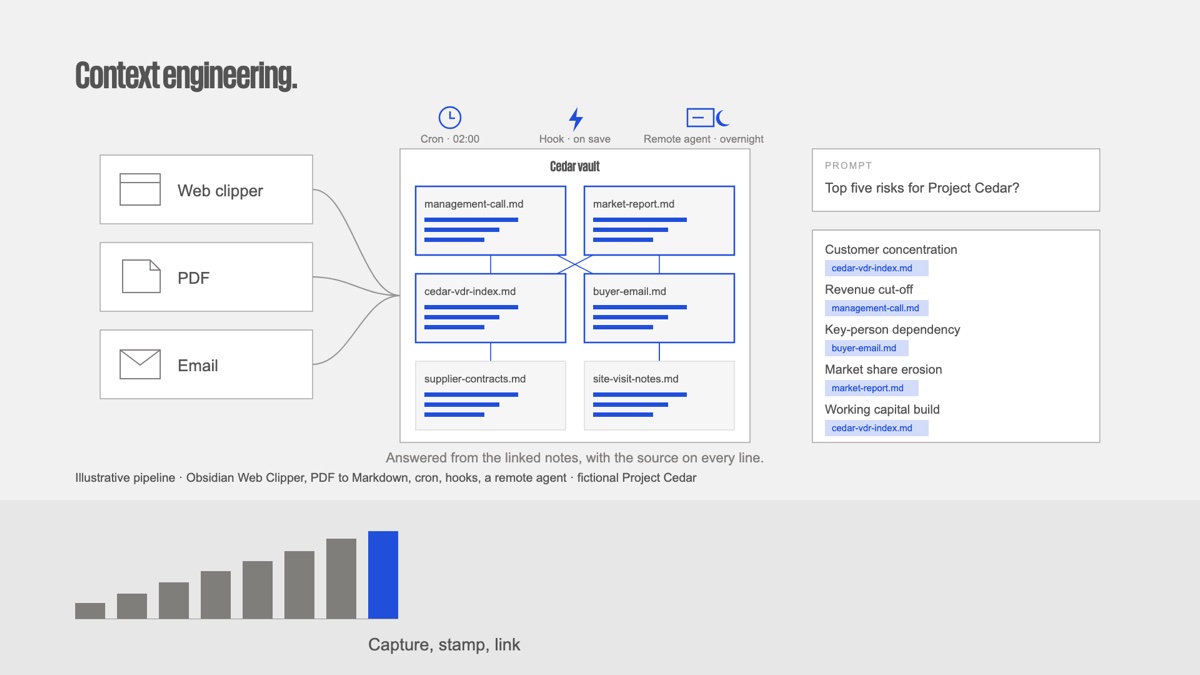
Context engineering
Capture, stamp, link. The answer comes back with the source on every line.
 Slide 19
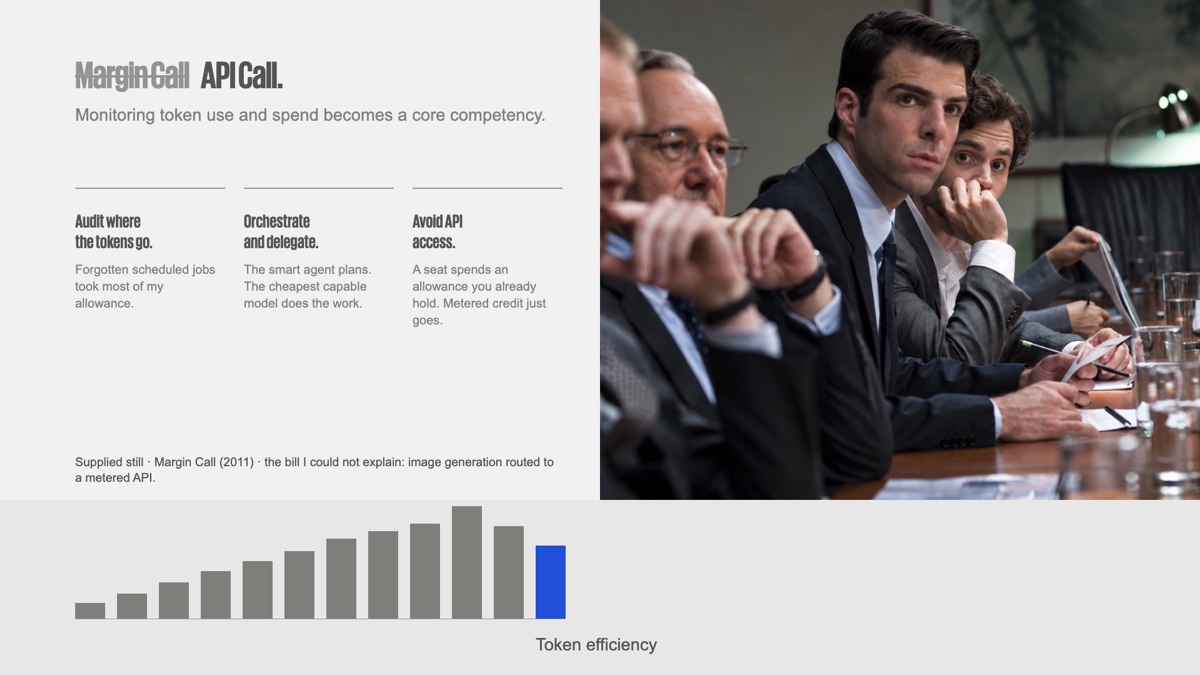
Margin Call → API Call
Monitoring token use and spend becomes a core competency.
 Slide 33
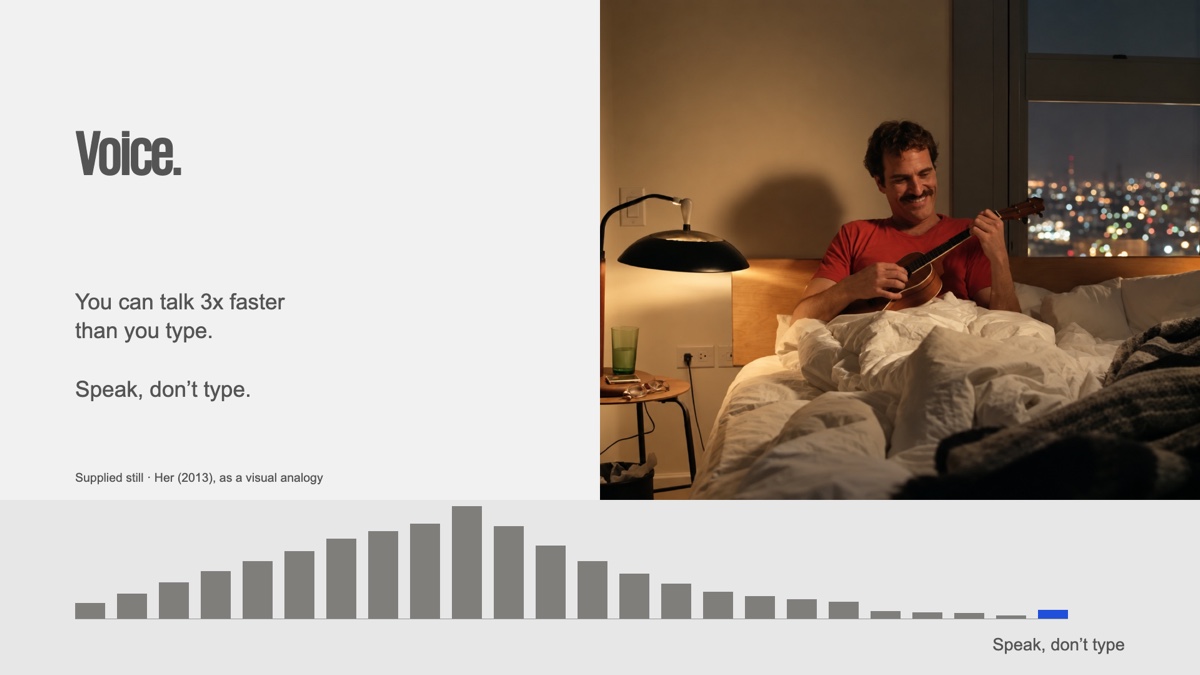
Speak, don’t type
You can talk 3x faster than you type, and the agent takes the mess.
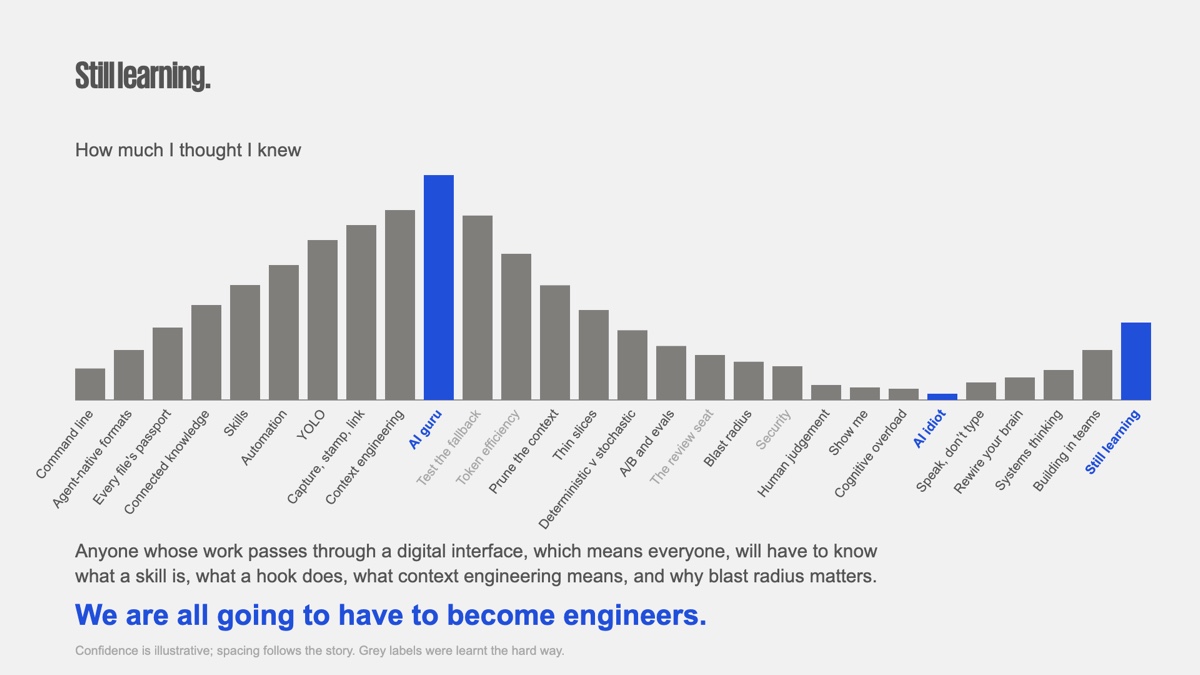 Slide 40
Still learning
Rise, collapse and a modest recovery, with the lesson at each step.
Earlier decks
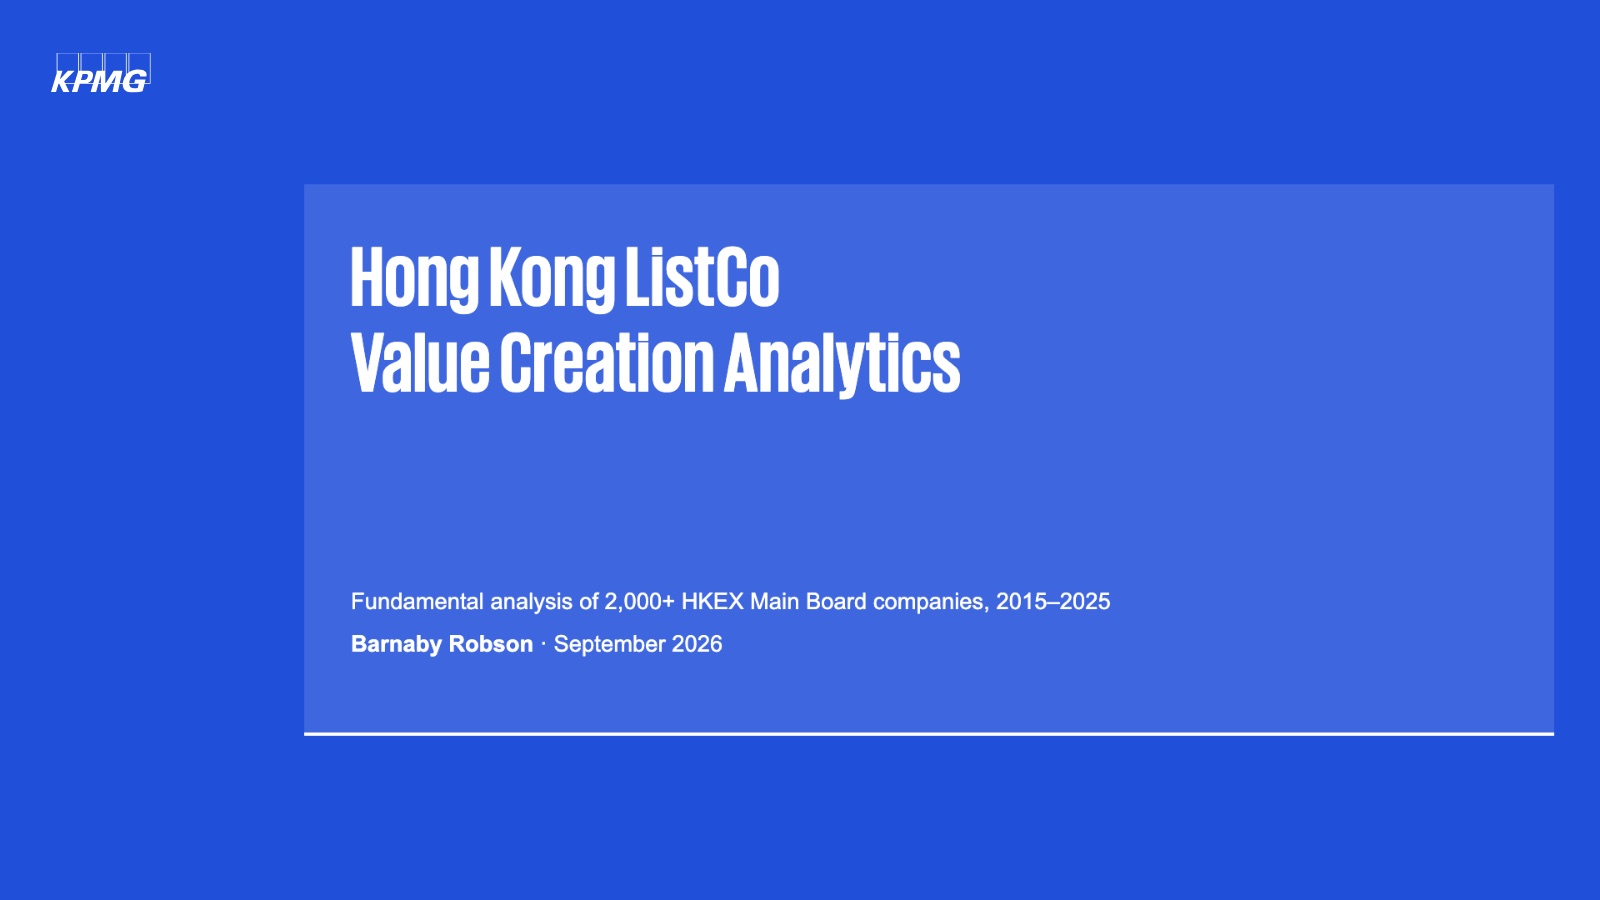
Data Deck · September 2026
Hong Kong ListCo Value Creation Analytics
Ten years of economic profit across 2,000+ HKEX Main Board companies. It turned negative in 2022 and stayed there, and twenty companies now generate 55% of the value created by 657 firms.
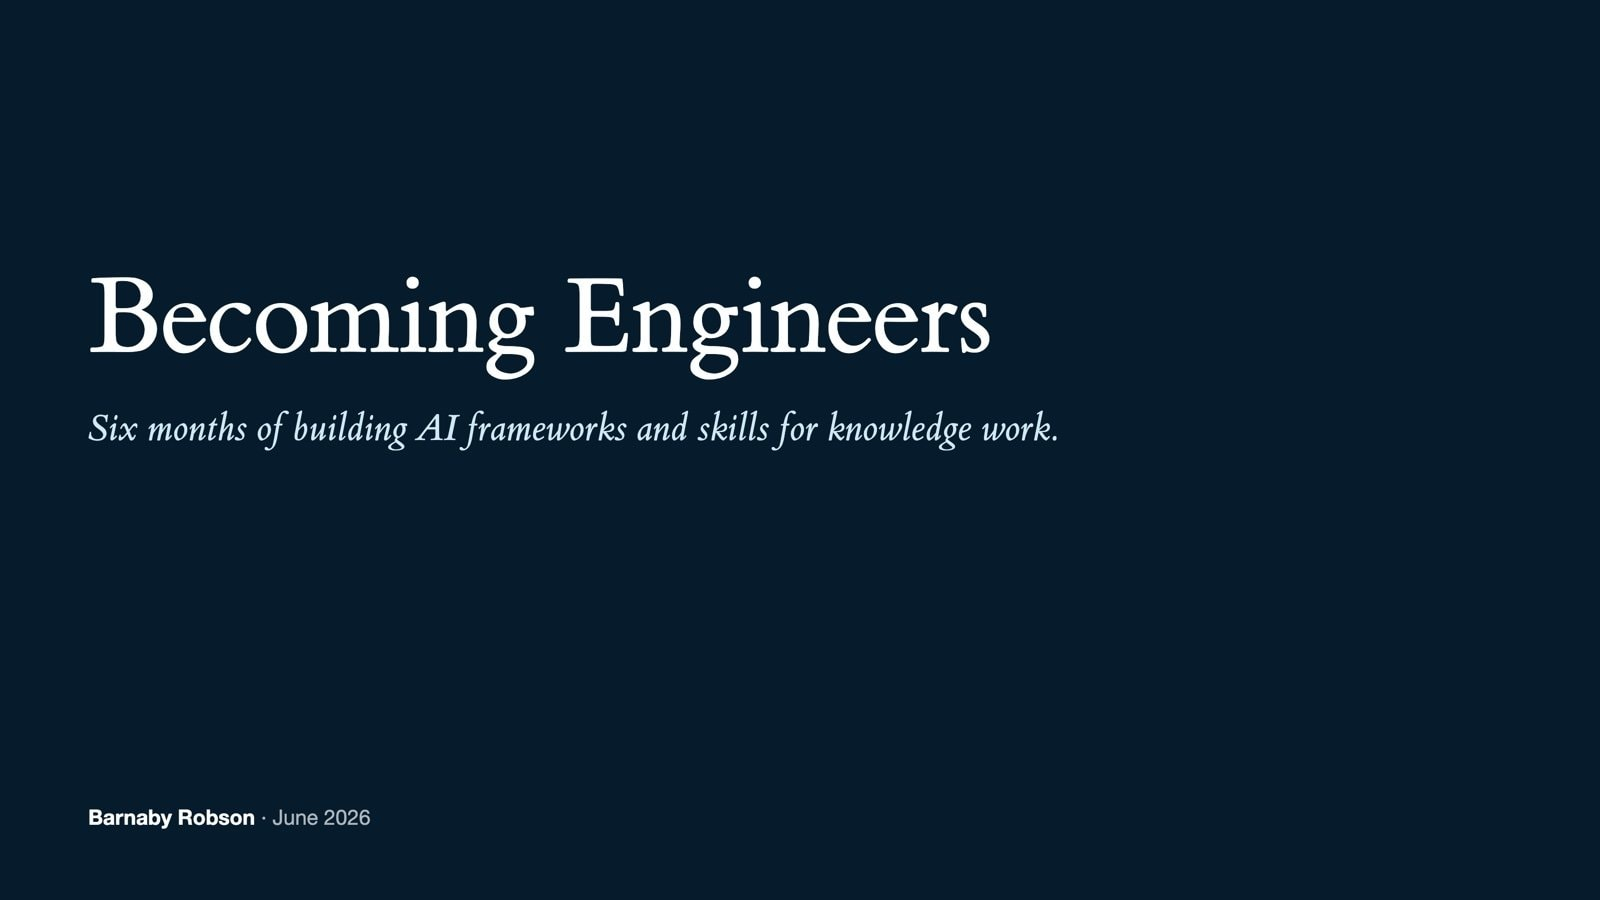
Keynote · June 2026
Becoming Engineers
Six months of building AI frameworks and skills for knowledge work — capture, organise, process, execute — shown through the real artefacts the stack produces.
Data Story · June 2026
All That Glisters
The gold Hong Kong’s MPF won’t let you hold. A data carousel through 447 pension funds — dispersion, fees, and the walls around the exit — told through Shakespeare.

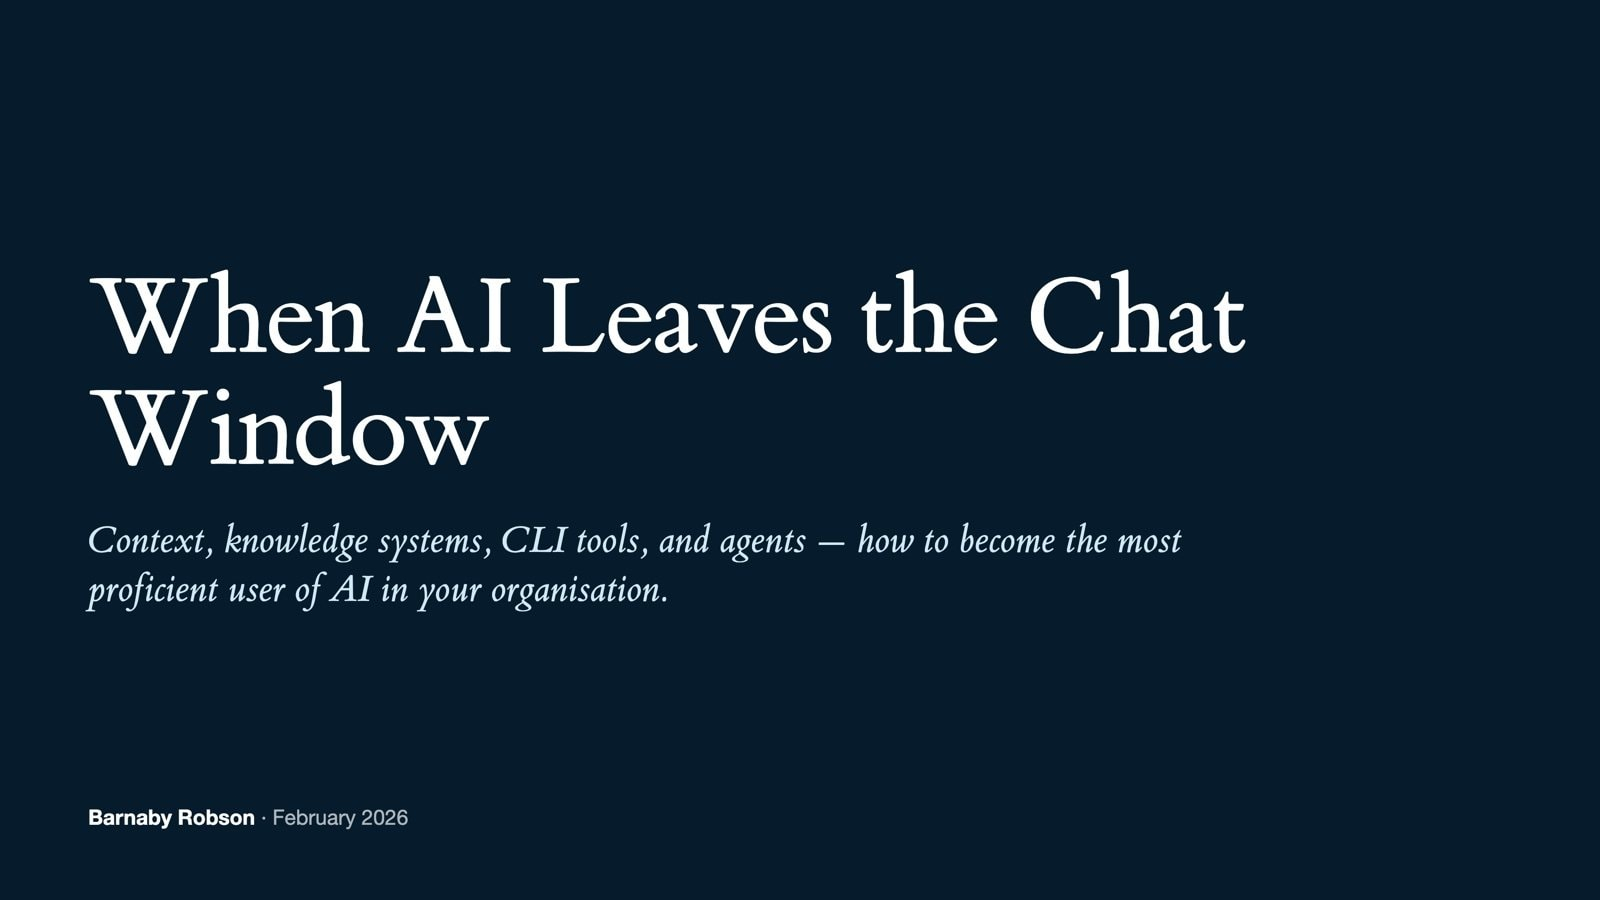
Executive Training · February 2026
When AI Leaves the Chat Window
Context, knowledge systems, CLI tools, and agents — how to become the most proficient user of AI in your organisation. An executive training session, end to end.
Speaking
Speak at your event
I speak at corporate, investor and board events — on M&A, capital markets, sector views, and what AI adoption really changes in knowledge work. Keynotes, panels, and hands-on workshops. The decks above come from these talks.
The AI toolkit holds the tools, skills and data feeds behind these decks, with links.