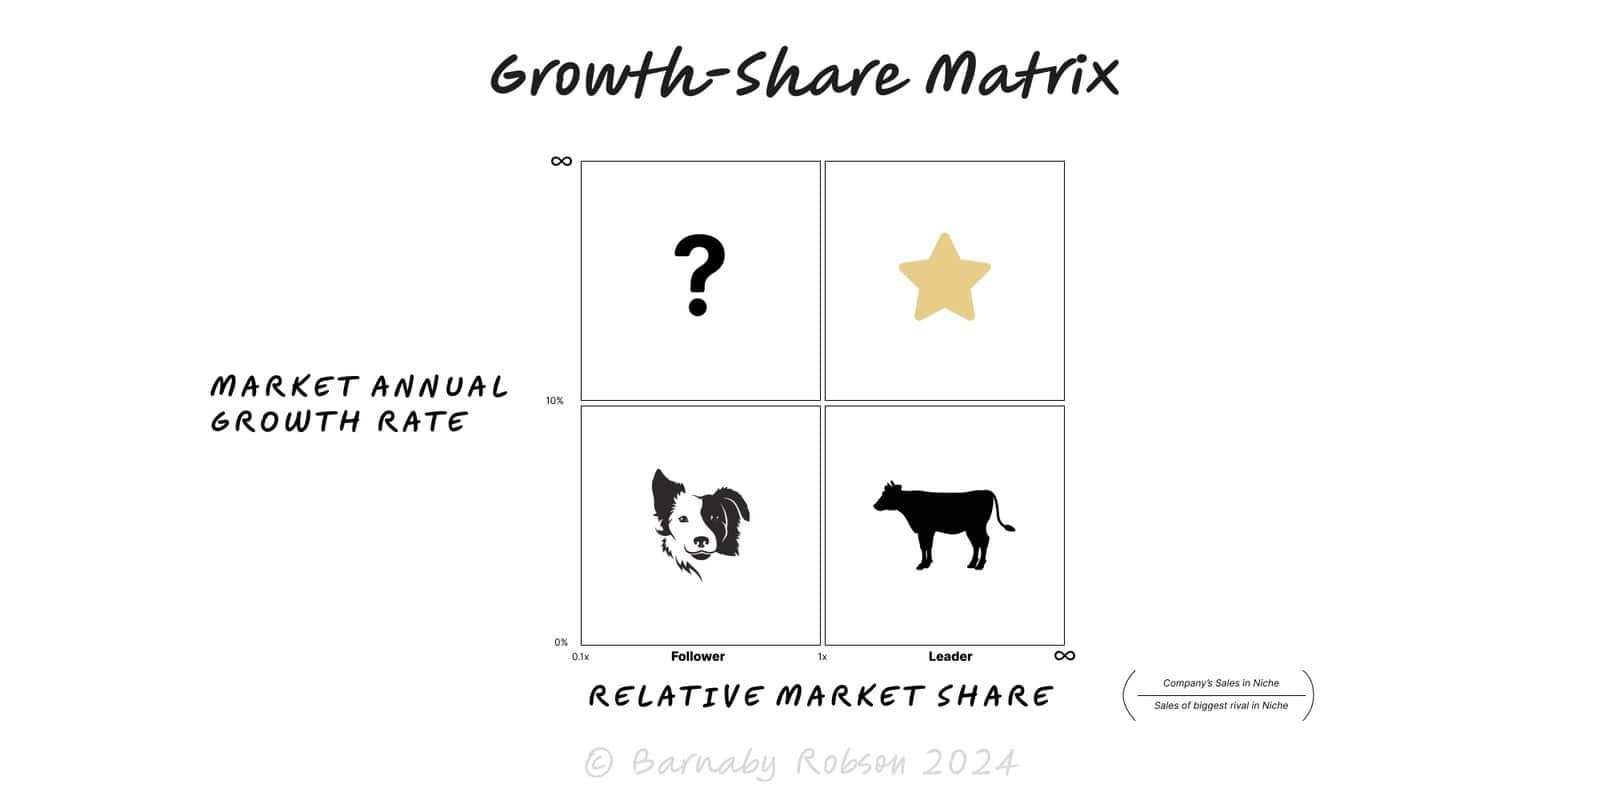
The Growth-Share Matrix
A portfolio tool from BCG that maps units by relative share and market growth to guide investment, harvest and exit decisions.
Author
Bruce D. Henderson, Boston Consulting Group
Model type
A portfolio tool from BCG that maps units by relative share and market growth to guide investment, harvest and exit decisions.
Bruce D. Henderson, Boston Consulting Group
Growth Share Matrix (BCG Matrix) tags categorize products or business units into four types based on their market growth rate and relative market share: Stars, Cash Cows, Question Marks, and Dogs.
How it works – Axes
X Axis: Relative market share: your share divided by the largest competitor’s share. Proxy for scale and experience-curve effects.
Y Axis: Market growth rate: proxy for investment need. Historically a 10 percent threshold was used; better to set a context-specific cut-off.
Quadrants & default plays
Stars: High growth, high share. Invest to maintain leadership; aim to become future Cash Cows.
Cash Cows: Low growth, high share. Optimise, “milk” cash; fund Stars/selected Question Marks.
Question Marks: High growth, low share. Decide: invest hard to win share or exit quickly.
Dogs: Low growth, low share. Harvest/exit unless they serve a clear strategic role (e.g. synergy, regulatory anchor).
Annual portfolio review to set capex, opex and marketing budgets by BU or SKU.
Pre-deal diligence to test an asset’s funding needs and exit options by line of business.
Post-merger product rationalisation and manufacturing footprint decisions.
Strategic planning for category entries and withdrawals; brand pruning.
PE value-creation planning to identify “funders” (Cows) and “funded” (Stars/selected QMs).
Define the market precisely per unit/SKU (avoid over-broad categories).
Compute relative market share vs the largest rival; pick a growth threshold that matches market physics.
Place each unit, then size the bubble by revenue or gross profit.
Stress test with forward-looking scenarios (price wars, new entrants, channel shifts).
Decide capital moves by quadrant, then layer constraints: capability, synergy, regulatory, and cash limits.
Over-simplification: profitability, unit economics and moats vary even at similar share/growth.
“Dogs” can be strategically valuable as complements, gateways or for regulatory presence.
Growth thresholds should be relative to industry lifecycle, not a fixed 10 percent.
Share is not a moat if network effects, switching costs or IP sit elsewhere.
Static snapshots mislead; use rolling 4Q or multi-year views.
Click below to learn other mental models

Before building, map the space: the key forks, dead ends and dependencies—so you can choose a promising path and run smarter tests.
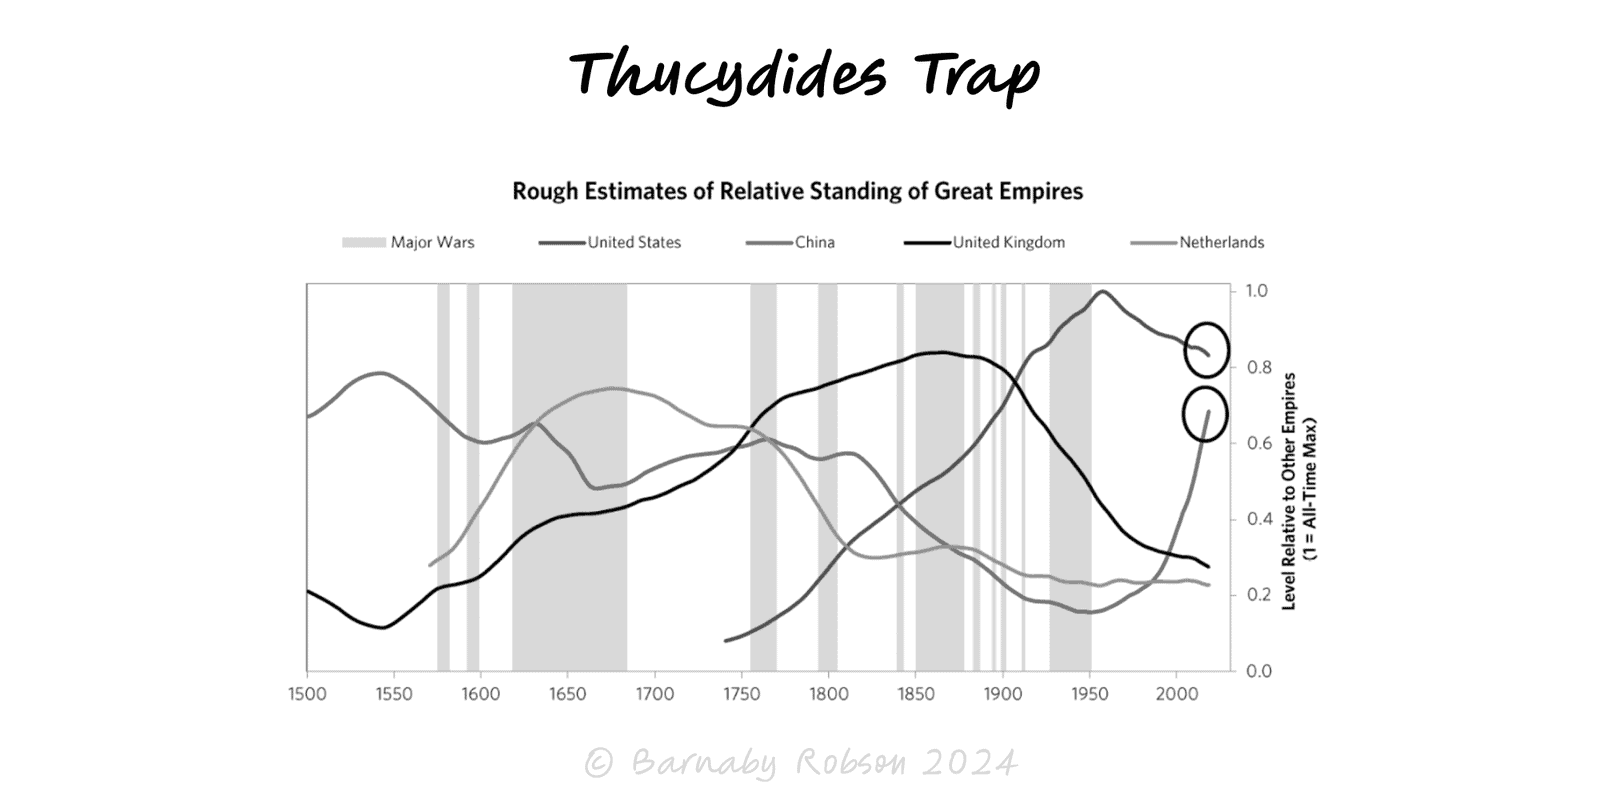
When a rising power threatens to displace a ruling power, fear and miscalculation can tip competition into conflict unless incentives and guardrails are redesigned.

Aim for vertical progress—create something truly new (0 → 1), not just more of the same (1 → n). Win by building a monopoly on a focused niche and compounding from there.