Pareto Principle (80/20)
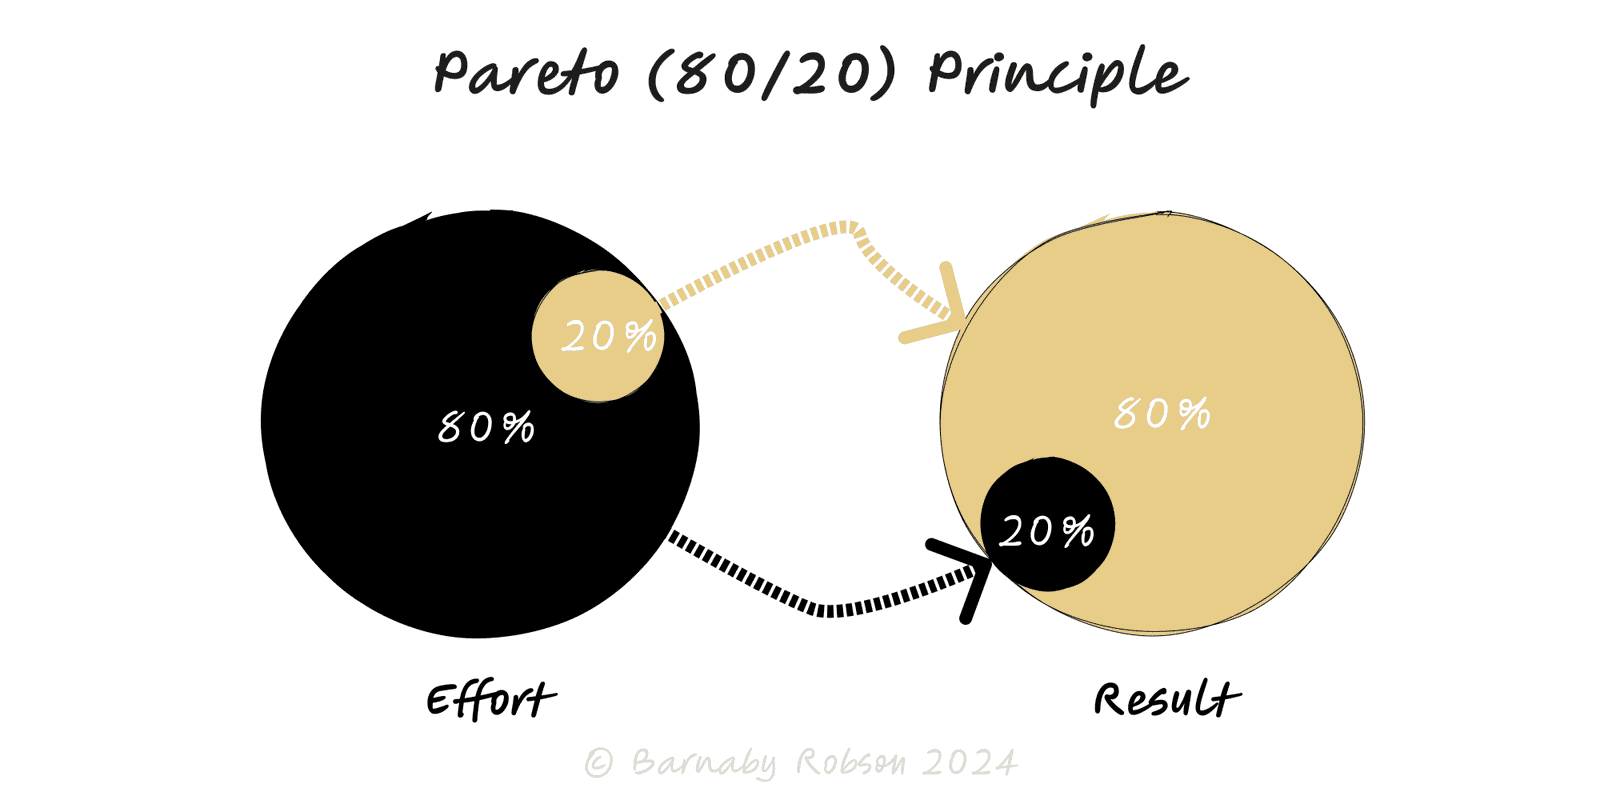
A minority of inputs often drives a majority of outcomes. Find the vital few, focus there first.
Author
Vilfredo Pareto (1896); generalised by Juran as the “vital few vs trivial many”
Model type
A minority of inputs often drives a majority of outcomes. Find the vital few, focus there first.
Vilfredo Pareto (1896); generalised by Juran as the “vital few vs trivial many”
The Pareto Principle is a practical heuristic drawn from skewed (often heavy-tailed) distributions: results are unevenly concentrated. It’s not a law of nature and not always 80/20, but the pattern is common—few products → most revenue, few defects → most failures, few tasks → most impact. The move is to identify concentration, act on the top contributors, and design a sane policy for the long tail.
Skewed contribution – rank items by impact (descending); cumulative impact rises steeply then flattens.
80/20 is a placeholder – real cut-points might be 70/30, 90/10, 65/35—use your data.
Visuals –
Why it appears – compounding effects, network/exposure differences, constraints, positive feedback, and variance.
Action logic – handle the vital few with disproportionate attention; standardise or batch the useful many; cap or drop the trivial tail.
Revenue & customers – top cohorts, SKUs, or channels drive most contribution.
Quality & reliability – few root causes explain most incidents/defects.
Product & UX – a handful of journeys/features create most value; simplify around them.
Growth & content – few pages/creators pull most traffic; optimise those first.
Inventory & procurement – ABC classification for stocking and vendor attention.
Personal effectiveness – identify tasks/meetings that actually move outcomes.
Define the outcome – revenue, failures, time, adoption, cost.
Collect and rank – list items (SKUs, causes, tasks) with measured impact; sort high → low.
Plot a Pareto chart – add cumulative %; mark where the curve bends (natural threshold).
Choose cut-offs – e.g., A (top ~10–20 percent of items) → high attention; B (next ~30 percent) → standard playbook; C (rest) → automate, cap, or prune.
Act on the vital few – bespoke fixes, premium SLAs, targeted experiments, root-cause elimination.
Set tail policy – minimum service levels, self-serve only, or discontinuation.
Review cadence – re-run monthly/quarterly; watch for drift as mix and seasonality change.
Worshipping 80/20 – use your distribution; don’t force the ratio.
Mean vs margin – optimise incremental ROI, not just biggest bars historically.
Tail blindness – small items may be strategic (emerging segments, reliability hotspots).
Goodhart risk – if you pay only on the top slice, gaming and neglect follow; add guardrails.
Stale rankings – today’s A-items can decay; keep the chart live.
Correlation ≠ cause – big bars show where to look, not why it happens.
Click below to learn other mental models

Before building, map the space: the key forks, dead ends and dependencies—so you can choose a promising path and run smarter tests.
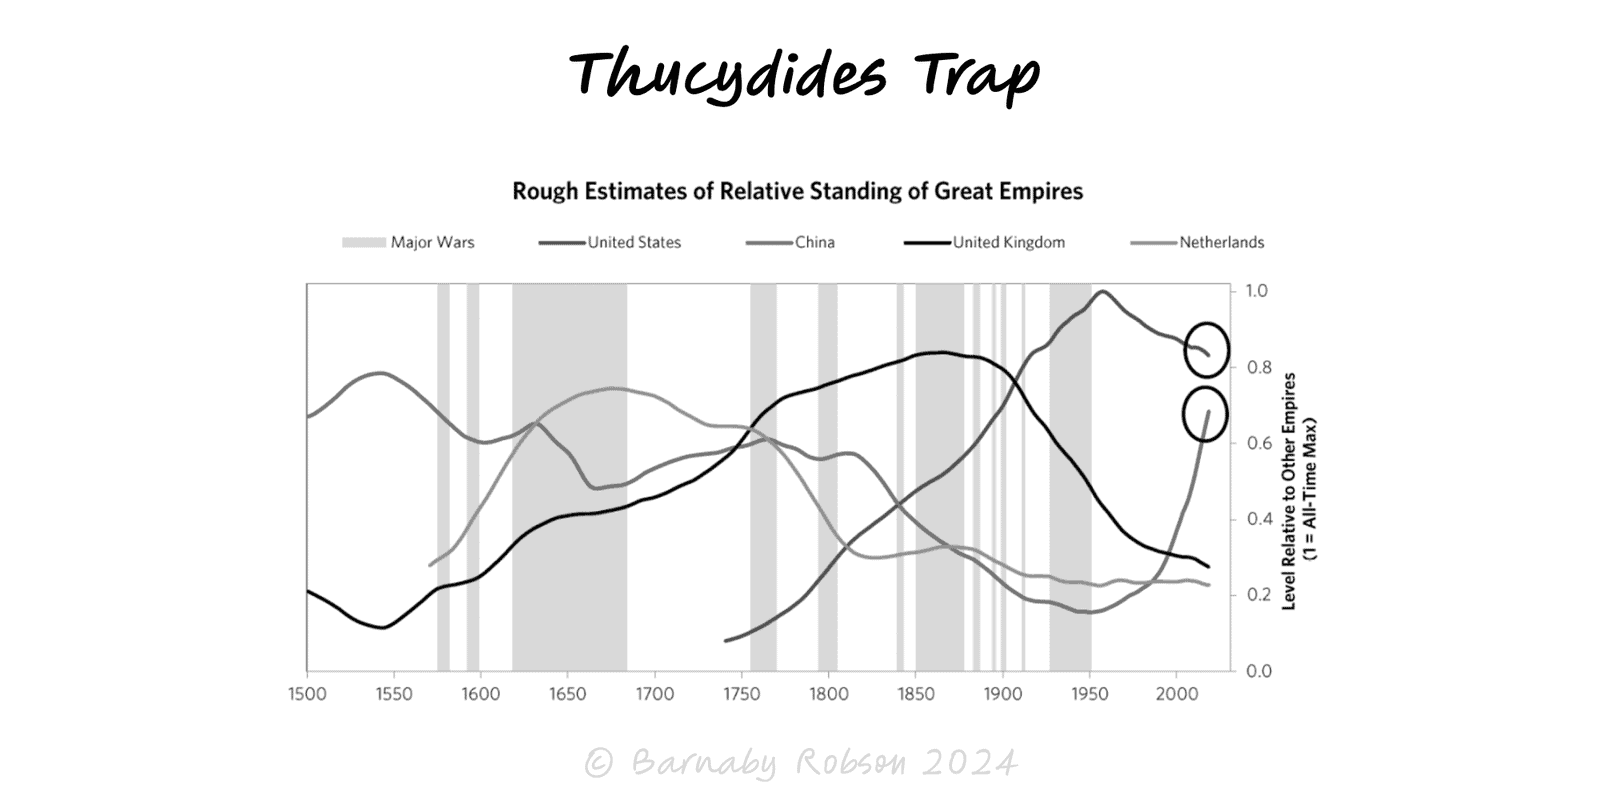
When a rising power threatens to displace a ruling power, fear and miscalculation can tip competition into conflict unless incentives and guardrails are redesigned.
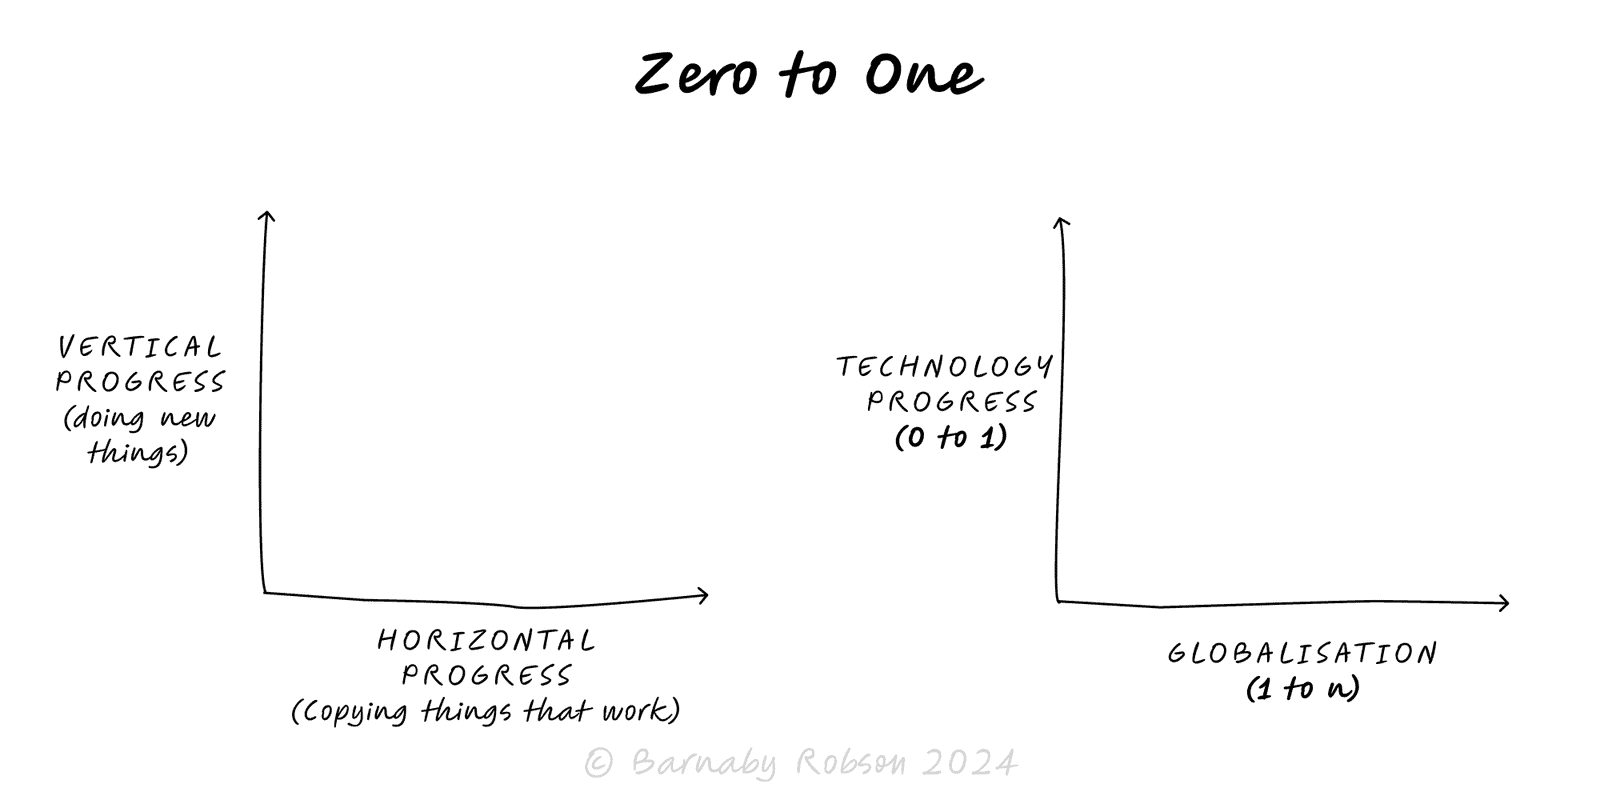
Aim for vertical progress—create something truly new (0 → 1), not just more of the same (1 → n). Win by building a monopoly on a focused niche and compounding from there.