Decision Tree
A visual of sequential decisions with probabilities and payoffs; fold back to compute expected value.
Author
Decision analysis (Howard Raiffa, Ronald A. Howard); machine-learning variants (CART, ID3)
Model type
A visual of sequential decisions with probabilities and payoffs; fold back to compute expected value.
Decision analysis (Howard Raiffa, Ronald A. Howard); machine-learning variants (CART, ID3)
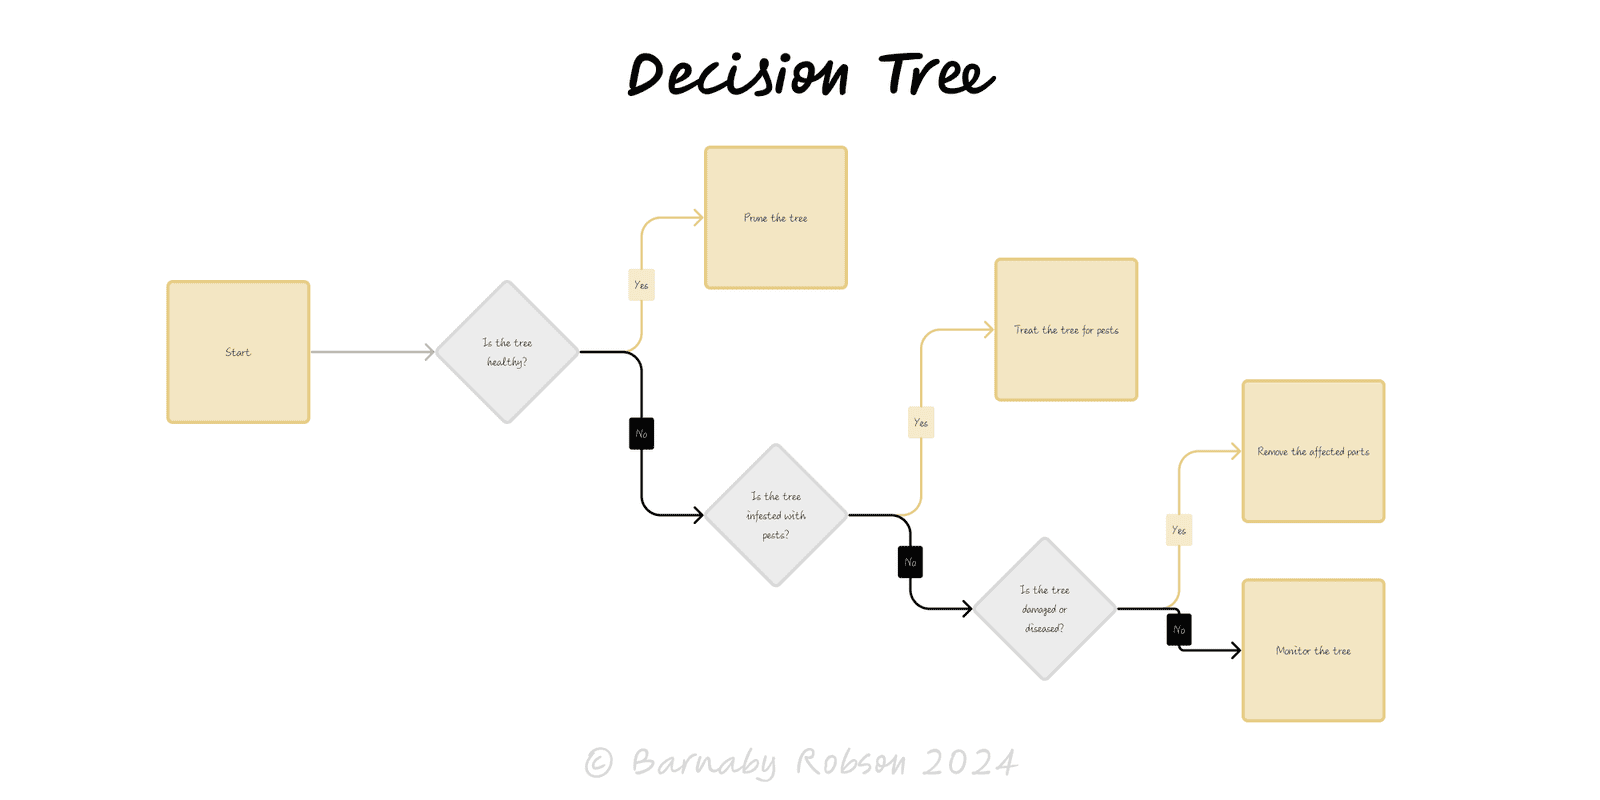
A decision tree is a visual, quantitative way to choose under uncertainty. Squares show decisions, circles show chance events, and triangles/end nodes show outcomes/payoffs. By assigning probabilities and payoffs, you can compute expected values, compare strategies, and see where extra information would change the choice. In data science, trees are learned from data; in decision analysis, you design the tree to structure the decision.
Nodes & branches
Rollback (fold-back) – compute expected value at each chance node and “roll back” towards the start; at decision nodes pick the branch with the higher EV (or higher utility if risk-averse).
Value of information – compare EV with and without new info (test, pilot) to get EVPI/EVSI; buy info only if it exceeds cost and delay.
Sensitivity – vary probabilities/payoffs; identify breakpoints where the preferred branch flips.
Pruning – collapse dominated or irrelevant branches; keep the tree readable.
Updating – if evidence arrives, update probabilities (Bayes) and rerun the rollback.
Product & GTM – feature launch vs pilot; channel tests; price experiments.
Operations – make/buy, supplier selection, maintenance vs replace.
Risk & compliance – controls investment vs breach cost; incident playbooks.
Clinical / troubleshooting – test-and-treat pathways; diagnostic flows.
Legal / negotiations – settle vs litigate, offer ladders and expected outcomes.
Data science – CART/GBTs for prediction when you have labelled data.
Define the decision – objective, options, horizon, and payoff unit (e.g., £EV, hours saved, utility).
Sketch the tree – decisions first, then uncertainties; avoid duplicating subtrees by re-using structure.
Assign probabilities – use data, expert judgement, or ranges; ensure each chance node sums to 1.
Assign payoffs – include costs, delays, risks; use present values if timing differs.
Rollback – compute EVs from right to left; select the highest-EV branch at each decision node.
Test sensitivity – vary key probabilities/payoffs; mark thresholds where the choice would change.
Check information value – calculate EVPI/EVSI for tests/pilots; only buy information that pays.
Decide & document – record inputs, EVs, breakpoints, and triggers to revisit (e.g., if p(success) < 0.35).
False precision – spurious decimals on weak assumptions; show ranges and breakpoints.
Omitted paths – leaving out realistic options or failure modes biases EV.
Probability errors – branches that don’t sum to 1; mixing conditional and unconditional probs.
Double counting – the same cost added on multiple branches.
Static view – not revisiting after new evidence; schedule an update trigger.
Utility blind – EV in £ ignores risk attitudes; use expected utility for large, risky stakes.
Click below to learn other mental models

Before building, map the space: the key forks, dead ends and dependencies—so you can choose a promising path and run smarter tests.
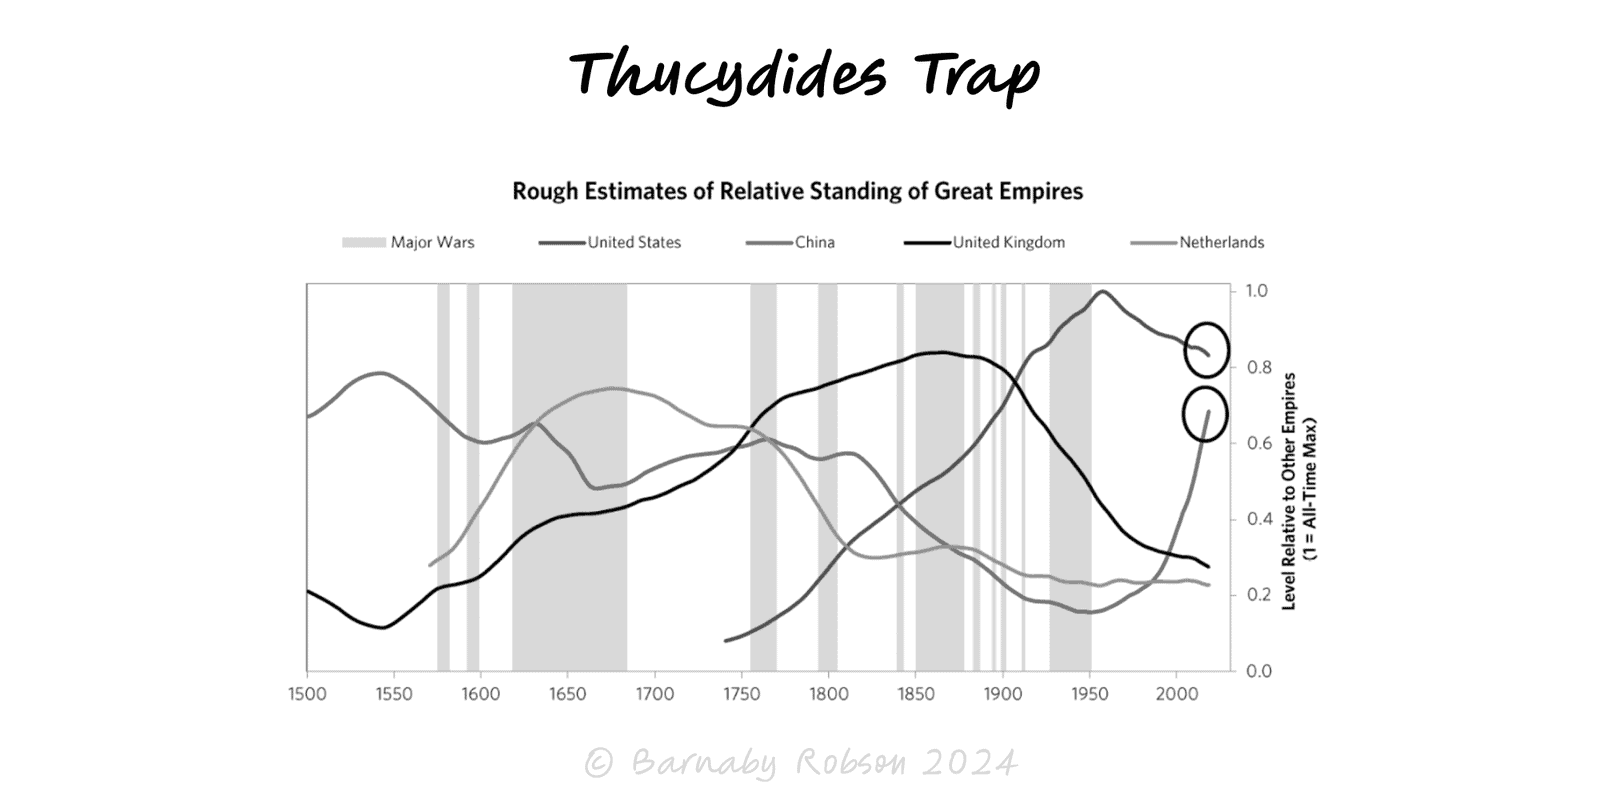
When a rising power threatens to displace a ruling power, fear and miscalculation can tip competition into conflict unless incentives and guardrails are redesigned.
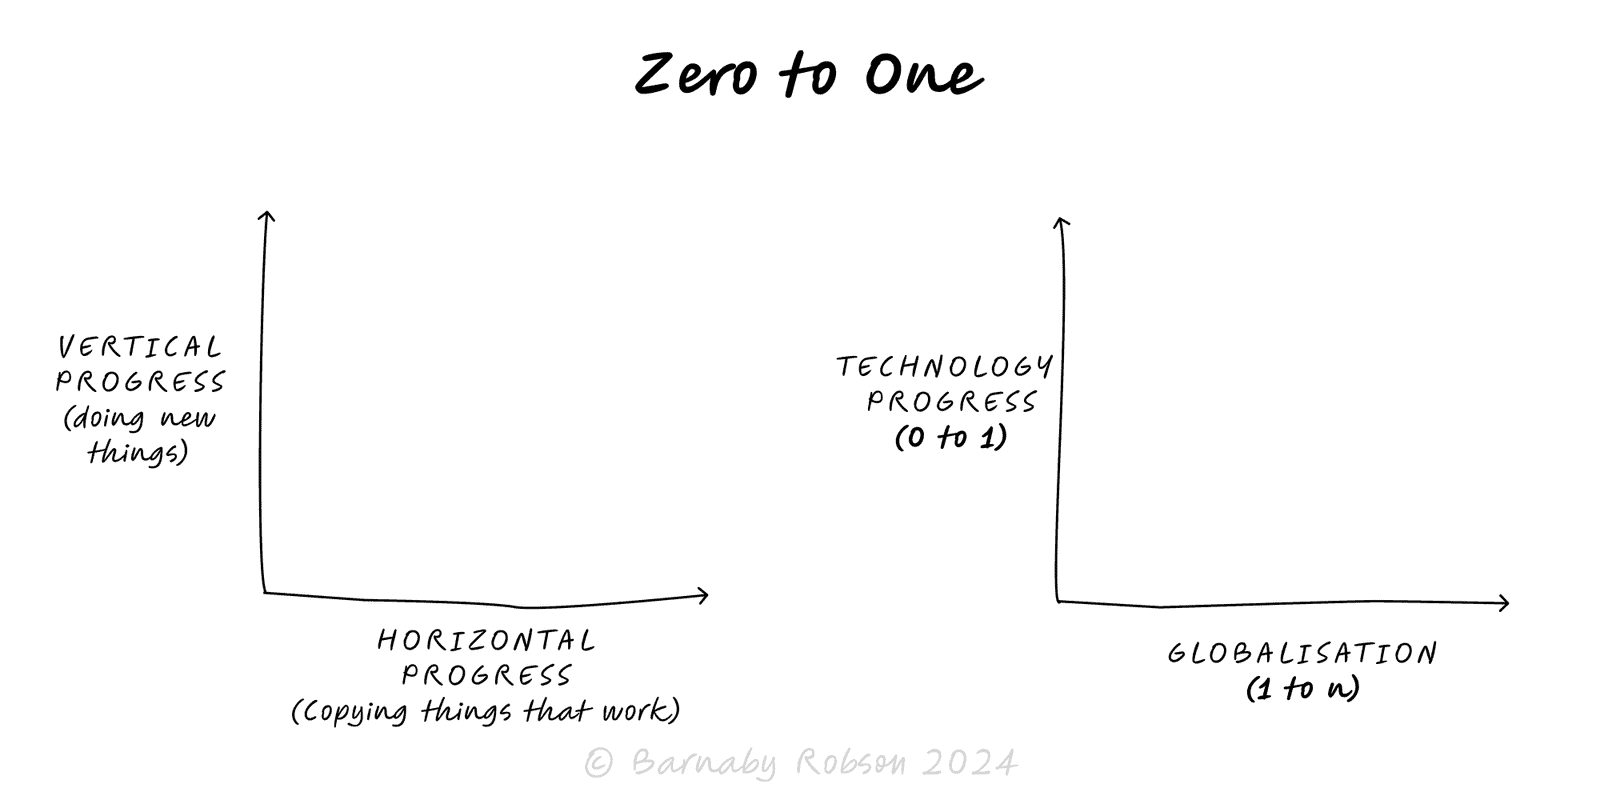
Aim for vertical progress—create something truly new (0 → 1), not just more of the same (1 → n). Win by building a monopoly on a focused niche and compounding from there.