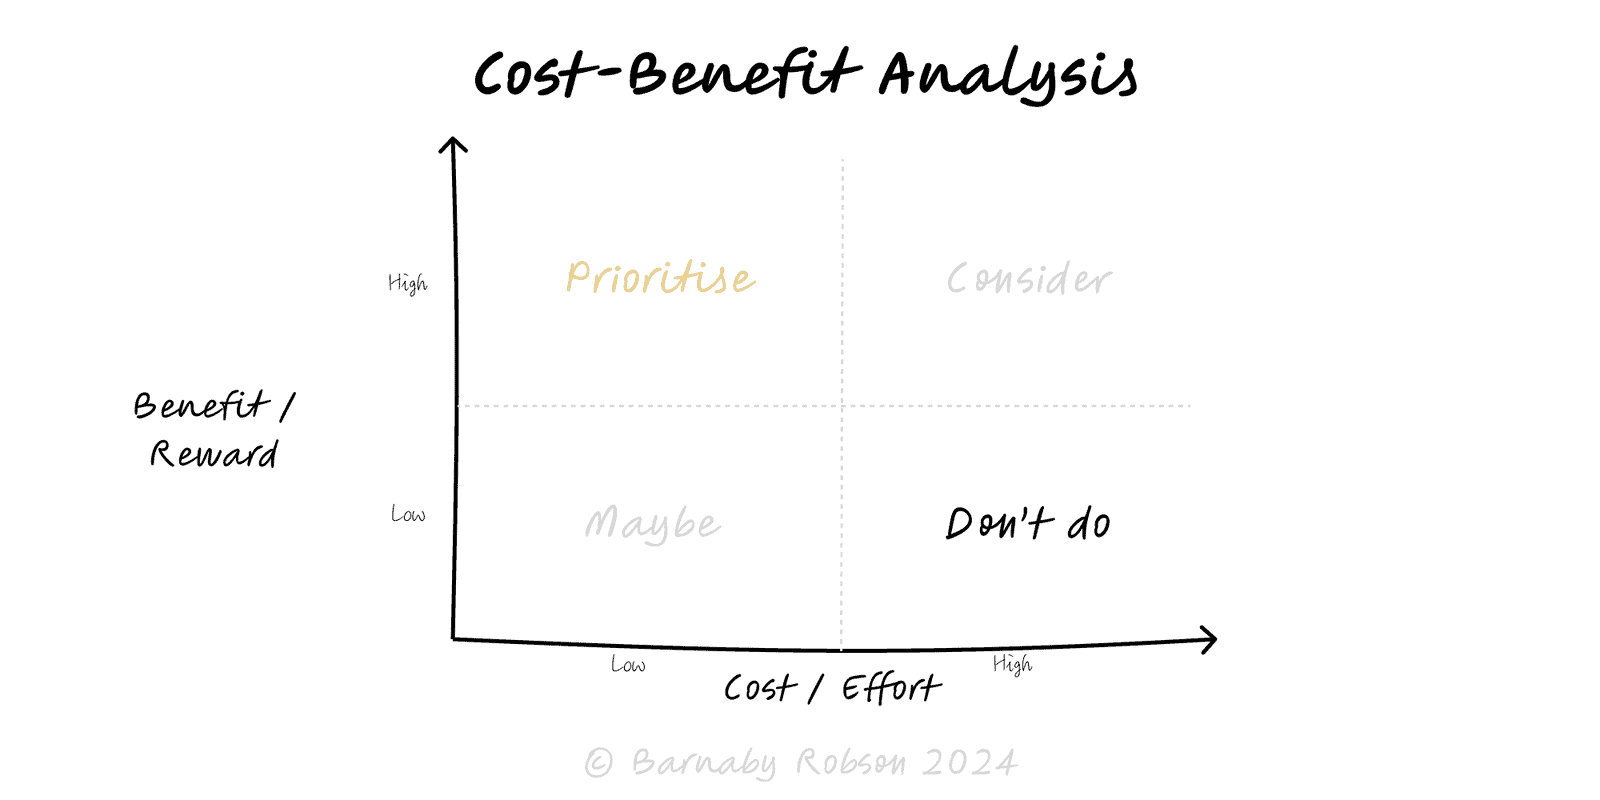
Cost-Benefit Analysis
Plot initiatives by benefit vs cost to spot quick wins, staged bets and time-sinks.
Author
Managerial decision-making (simple cost–benefit prioritisation)
Model type
Plot initiatives by benefit vs cost to spot quick wins, staged bets and time-sinks.
Managerial decision-making (simple cost–benefit prioritisation)
This is the lightweight, visual form of cost–benefit analysis. Instead of detailed NPV spreadsheets, you estimate benefit and effort/cost on consistent scales and place items on a 2×2 grid. It’s ideal for backlog grooming, roadmap picks and operational improvements where speed and clarity matter.
Axes
Quadrants
Backlog grooming and sprint planning.
Portfolio and roadmap selection.
Ops improvements and process changes.
Compliance and risk mitigations triage.
Define benefit and cost scales – e.g. 1–5 or T-shirt sizes; write what each level means.
Score together – cross-functional group estimates both axes; capture assumptions.
Plot the items – place each initiative on the grid; cluster similar ones.
Decide –
Prioritise the top-left first.
For top-right, break into milestones or run a small proof-of-value.
Bottom-left only if they unblock others.
Bottom-right is a no unless the idea can be redesigned.
Add guardrails – owner, success metric, review date; re-plot when facts change.
Hand-wavy scales – define benefit and cost levels up front or estimates drift.
Optimism bias – inflate benefit, deflate effort; counter with ranges and a quick premortem.
One metric only – if benefits are mixed (revenue + risk), agree a composite or use separate grids.
Crowding the middle – force choices by limiting how many can sit in “Consider” or “Maybe”.
Never upgrading evidence – for big bets in “Consider”, follow up with a proper NPV/EV analysis.
Click below to learn other mental models

Before building, map the space: the key forks, dead ends and dependencies—so you can choose a promising path and run smarter tests.
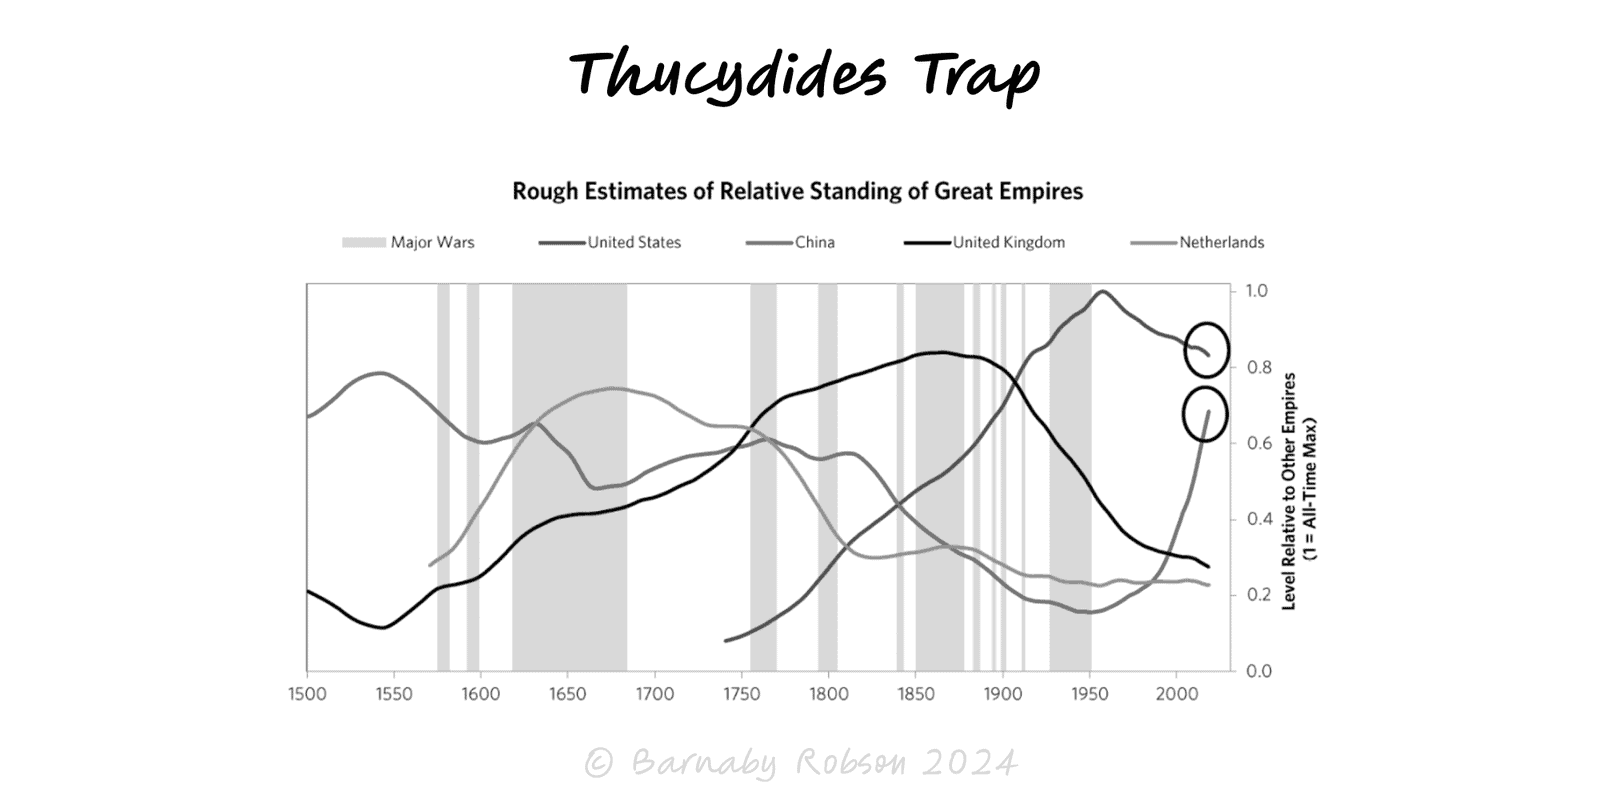
When a rising power threatens to displace a ruling power, fear and miscalculation can tip competition into conflict unless incentives and guardrails are redesigned.
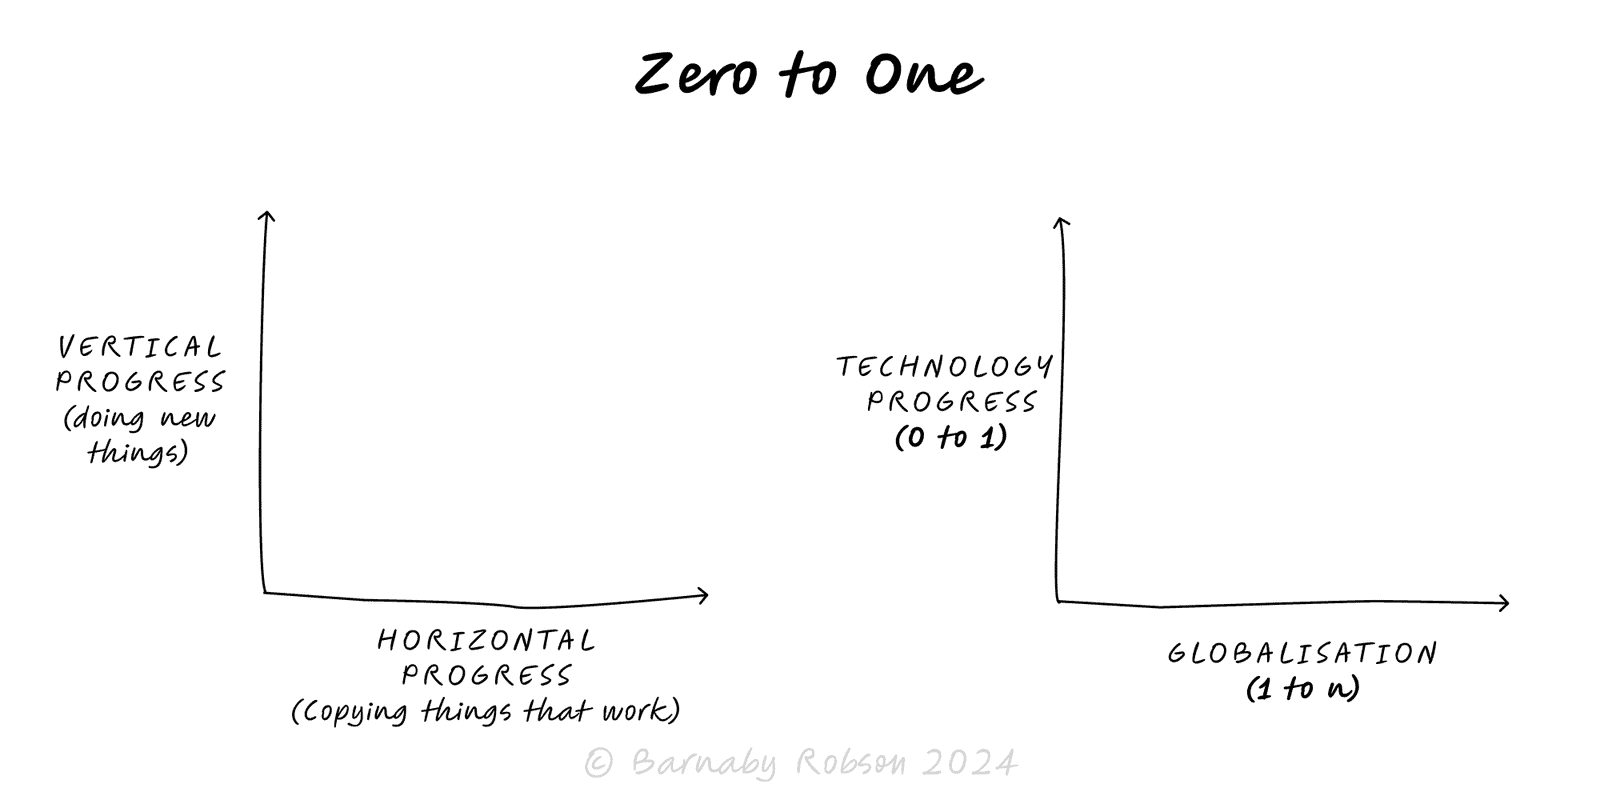
Aim for vertical progress—create something truly new (0 → 1), not just more of the same (1 → n). Win by building a monopoly on a focused niche and compounding from there.