Hong Kong ListCo
Value Creation Analytics

The Report

Hong Kong, the capital allocator’s market · August 2026

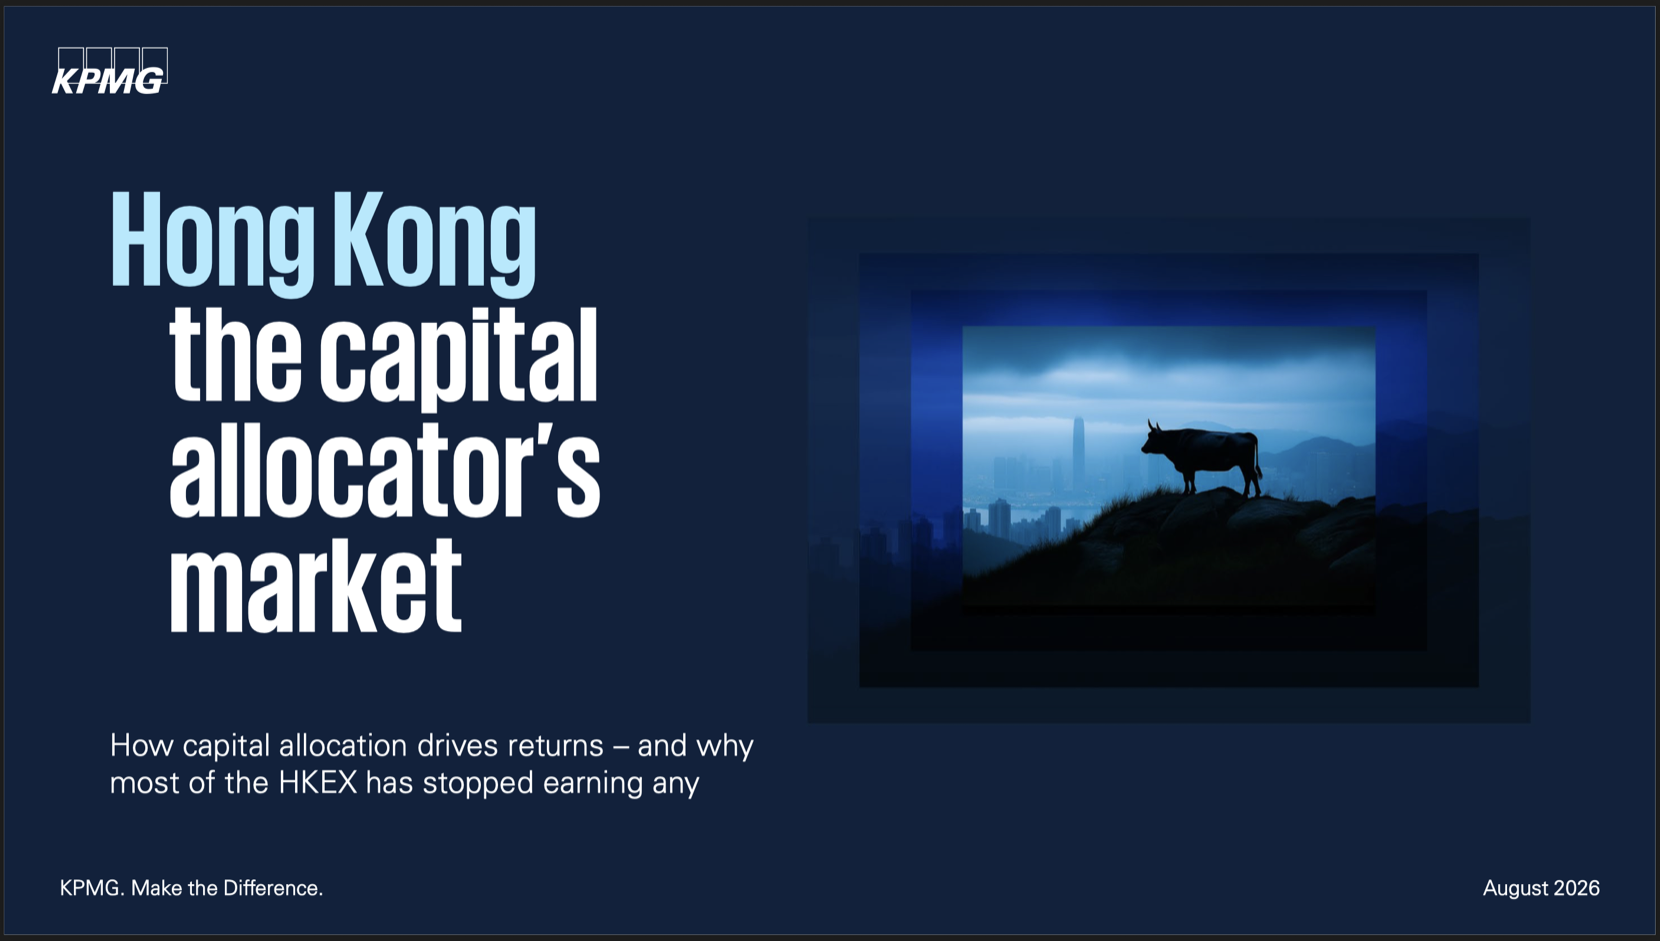
Cover of Hong Kong, the capital allocator's market
CO-AUTHORS
Jordan Sanders

Jordan Sanders

Barnaby Robson

Barnaby Robson

QR code for the report
READ THE PAPER
Scan for the full report
KPMG China · August 2026

Hong Kong accounts for 3.9% of global equity value

Hong Kong, the world's 5th largest equity market.

2025 global equity market capitalisation. Rectangle area = market value.

Hong Kong accounts for 3.9% of global equity value Each rectangle's area is proportional to 2025 equity market capitalisation. Values in US dollars: United States 68.9 trillion; China 15.5; European Union 15.5; Other developed markets 13.6; India 10.6; Japan 7.6; Other emerging markets 6.9; Hong Kong 6.1; United Kingdom 5.6; Canada 4.6; Australia 2.0; Singapore 0.8. Hong Kong is highlighted in blue. UNITED STATES $68.9tn 43.7% of global value CHINA $15.5tn INDIA $10.6tn JAPAN $7.6tn HONG KONG $6.1tn · 3.9% SINGAPORE · $0.8tn 😂 EU $15.5tn UK $5.6tn OTHER DEVELOPED $13.6tn OTHER EMERGING $6.9tn CANADA $4.6tn AUSTRALIA $2.0tn

Source: World Federation of Exchanges via SIFMA, 2026 Capital Markets Fact Book. Twelve values sum to USD157.8tn.

Hong Kong led global IPO fundraising as turnover rebounded

2025 brought USD37bn of IPO proceeds and HKD250bn of average daily turnover.

IPO funds raised, USD bn

Hong Kong led global IPO fundraising as turnover rebounded Horizontal bars rank the ten leading IPO venues in 2025. A line chart shows HKEX average daily turnover from 2021 to 2025. HKEX average daily turnover, HKD bn Hong Kong37 NASDAQ28 India23 New York22 Shanghai15 Shenzhen13 Japan8 NASDAQ Nordic8 Saudi Arabia4 Germany3 167125105132250 20212022202320242025

Source: HKEX Annual Market Statistics; exchange disclosures; KPMG analysis.

Hong Kong trades below New York, London and Shanghai

Its median P/E was 11.9× in 2025, against 15.2×–29.1× on the three other exchanges shown.

Median price-to-earnings ratio by stock exchange, 2019–2025

Hong Kong trades below New York, London and Shanghai Seven-year line chart comparing median P/E ratios on HKEX, NYSE, LSE and Shanghai. 30×20×10×

Source: Capital IQ; KPMG analysis. Exchange medians include companies with positive earnings.

Christian Bale portraying Michael Burry in The Big Short

MICHAEL BURRY · CASSANDRA UNCHAINED

Hong Kong stocks are in the dumps.

“Hong Kong stocks are in the dumps, and have been there for some time. This was not always the case. I know, I was there in 2005.....

In October 2020, Jack Ma publicly bristled at perceived suppression of innovation in China. This offended Beijing. Within 10 days, Alibaba’s planned IPO of Ant Group was cancelled, and Beijing launched a two-year regulatory crackdown on China’s entire technology sector.

The peaking Hang Seng found no succor as the property market teetered into an epic descent, and COVID erupted from China and ran through China’s customers. Then came 3 years of lockdowns.....

These companies deserve a re-evaluation, a deep look into vulnerabilities, virtues, and value.”

Quote supplied by Barnaby Robson. Image: The Big Short (2015), supplied frame.

Economic profit is the clearest test of value creation

We tested whether Hong Kong’s discount reflected weak value creation.

Economic profit is the clearest test of value creation Return on invested capital minus the weighted average cost of capital gives the spread. Multiplying that spread by the capital employed gives economic profit. A positive result creates value and a negative result erodes value. RETURN EARNED CAPITAL COST SPREAD ROIC WACC = SPREAD VALUE CREATED OR ERODED SPREAD × CAPITAL EMPLOYED = ECONOMIC PROFIT < 0 VALUE ERODED 0 BREAK-EVEN > 0 VALUE CREATED

ROIC and WACC apply to non-financial companies. Financial companies use ROE and cost of equity. Source: KPMG, Hong Kong - the capital allocator's market, August 2026.

Economic profit turned negative in 2022 and stayed there

71% of HKEX companies earned less than their capital cost in 2025.

Aggregate economic profit, HKD bn, 2015–2025

+1,000 0 -2,000

Financial companies use return on equity and cost of equity. Source: Capital IQ; KPMG analysis.

Capital grew more than twice as fast as profit

From 2015 to 2025, invested capital and equity grew 92%; profit grew 43%.

Capital and profit, indexed to 100 at 2015

200 150 100

Capital uses invested capital for non-financial companies and equity for financial companies. Source: Capital IQ; KPMG analysis.

New capital earned 3.0 points below its cost

Across 2015–2025, the market earned 4.9% on new capital against a 7.9% cost.

Incremental return minus estimated capital cost

4.9% RETURN ON NEW CAPITAL 7.9% COST OF CAPITAL = −3.0 percentage points EVERY ADDITIONAL DOLLAR REDUCED ECONOMIC PROFIT

Incremental return approximates the change in profit divided by the change in capital, using 2015 and 2025 endpoints. Source: Capital IQ; KPMG analysis.

The HSI held an 11% return as the long tail fell to 3.5%

Scale helps, although 26 of 93 Hang Seng Index constituents still destroyed value in 2025.

Return on invested capital, non-financial companies, 2015–2025

12% 8% 4%

Aggregate ROIC of non-financial companies; HSI constituents versus the rest of HKEX. Source: Capital IQ; KPMG analysis.

Six of eleven sectors destroyed value in 2025

Real Estate fell to −7.0 points while Communication Services reached +8.8 points.

Return minus capital cost, percentage points, 2020 to 2025

2020 2025 0

Financials use ROE minus cost of equity; other sectors use ROIC minus WACC. Source: Capital IQ; KPMG analysis.

Twenty companies generated 55% of the value created by 657 firms

The top ten contributed 40%; the next ten added 15%.

Positive economic profit, 2025, HKD bn

Twenty companies generated 55% of the value created by 657 firms Twenty horizontal bars show the largest positive economic-profit contributors. A share strip shows the top ten at 40 per cent, the next ten at 15 per cent and 637 other value creators at 45 per cent. TOP 10 · 40%NEXT 10 · 15%OTHER 637 VALUE CREATORS · 45% TOP 10NEXT 10 Tencent206 China Life131 Alibaba95 CNOOC80 CATL61 Ping An58 China Mobile53 Zijin51 Xiaomi49 AIA39 HSBC35 NetEase34 PICC33 Shenhua31 CPIC31 Prudential30 Midea28 CMOC28 New China Life28 BYD26

Source: Capital IQ; KPMG analysis. The remaining 637 value creators contributed HKD923bn.

ROIC reveals the operating model behind the return

For non-financials: ROIC = NOPAT margin × invested-capital turnover.

Two operating levers determine the return on capital

ROIC reveals the operating model behind the return ROIC decomposes into NOPAT margin and invested-capital turnover. ROIC NOPAT margin profit after tax ÷ revenue Invested-capital turnover revenue ÷ invested capital × Profitability earn more from each sale Capital efficiency generate more sales from each dollar invested

Financial companies use the ROE analogue. Source: Capital IQ; KPMG analysis.

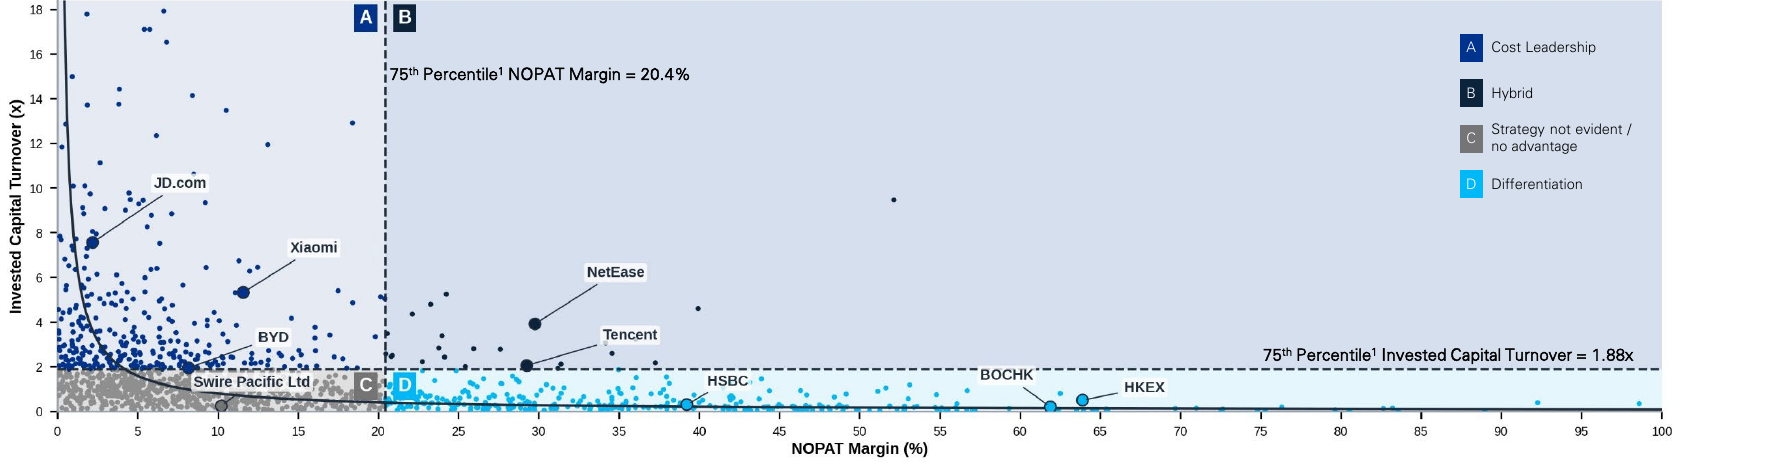
52% of profitable companies show no evident strategic advantage

52% sit below both strategy thresholds for margin and capital turnover.

2025 NOPAT margin versus invested-capital turnover

Source KPMG strategy map of profitable HKEX companies
52%: no evident advantage Thin margins and slow capital turnover.
Two routes to stronger returns Raise margin, turn capital faster, or improve both.

Source: Capital IQ; KPMG analysis. Profit-making HKEX Main Board companies, 2025. Thresholds are the 75th percentiles: 20.4% margin and 1.88× turnover.

The return spread determines the capital-allocation choice

Invest, restructure, divest or reallocate.

Capital-allocation decision matrix

The return spread determines the capital-allocation choice A two-by-two matrix links invested capital and return above capital cost to four management actions. DESTROYING VALUETransform or turn aroundRestructure CREATING VALUEPositive spread at scaleInvest RELEASING VALUENegative spread at low scaleDivest LIMITING VALUEPositive spread with limited capitalReallocate or scale RETURN SPREAD: ROIC − WACCNEGATIVEPOSITIVE INVESTED CAPITALHIGHLOW

Source: KPMG, Hong Kong - the capital allocator's market, August 2026.

Large Hong Kong groups are making capital allocation explicit

Jardines, HSBC and Swire now publish return targets and explicit capital-reallocation actions.
JARDINE MATHESON · INVESTOR DAY 2026
Clear targets.
Sharper focus.
Enhanced returns.
9%+
annual five-year TSR target
US$4bn capital recycling
US$500m share buyback
SWIRE PACIFIC · 2025 RESULTS
Disciplined capital allocation
HK$2.0bn
property divestments in 2025
Core-market investment
Share buy-backs
Progressive dividends
HSBC
STRATEGIC REPORT 2025
Exit low-return activities.
Reallocate to competitive strengths.
11
exits announced in 2025
$1.5bn
incremental investment capacity
Completed and announced exits are expected to generate US$0.7bn in annualised savings.

Sources: Jardine Matheson Investor Day, 16 June 2026; HSBC Strategic Report 2025; Swire Pacific 2025 annual results presentation.

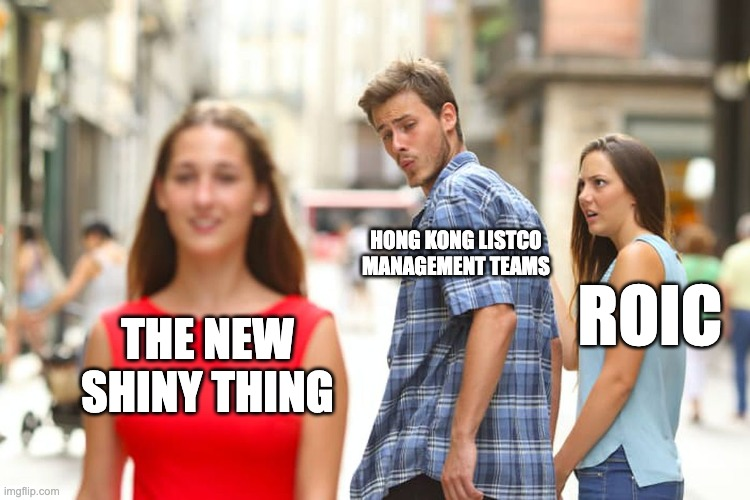
Distracted boyfriend meme: Hong Kong listed-company management teams look towards the new shiny thing while ROIC watches

THE #1 MANAGEMENT PRIORITY

Earn more than the capital costs.

A company is worth the capital it employs only when it earns more than that capital costs, for long enough to matter.

Invest the next dollar where it can return more than it costs. When it cannot, hand the capital back.

Hong Kong's next decade will sort companies by how seriously they take that sentence.

Source: KPMG, Hong Kong, the capital allocator's market, August 2026.

Turn the value-creation lens into four management decisions

Find erosion, repair returns, reallocate capital and embed discipline.

Find erosion

Which segments
earn below cost?

Repair returns

Where can margin or
turnover improve?

Reallocate

Where should the
next dollar go?

Embed

Implement measures
and incentives
linked to ROIC

Appendix: five questions for a board

Start with where the next dollar goes and what it will earn.

01

Where should the next dollar go?

Invest the next dollar where it can return more than it costs. When it cannot, hand the capital back.

02

What will the next dollar earn?

Judge each new decision on the profit it adds and the capital it requires. The historical average can hide current economics.

03

How long can the return last?

A durable modest return can be worth more than a high return that fades quickly.

04

What is the valuation signalling?

A persistent discount signals doubt about future returns. Improve the economics and show the evidence.

05

Which investment is hidden in expenses?

Software, data, brands and capabilities still consume capital. Test whether the spending earns its cost.

Boardroom implications derived from the study's economic-profit framework.

Shameless Plugs

Recent KPMG papers our team has authored on strategy, value creation and transformation. Newest first.

AI’s Workforce Collision publication cover
AUGUST 2026

AI’s Workforce Collision

The graduate handbrake meets the demographic time-bomb.

QR code for AI’s Workforce Collision
Splintering Supply Chains publication cover
JUNE 2026

Splintering Supply Chains

Trade shocks, intermediary hubs and resilience.

QR code for Splintering Supply Chains
Winning the Carve-out Relay publication cover
MARCH 2026

Winning the Carve-out Relay

A playbook for separation and value delivery.

QR code for Winning the Carve-out Relay
Decoding Value publication cover
NOVEMBER 2025

Decoding Value

The metrics and drivers of corporate value creation.

QR code for Decoding Value
Value Creation in Private Equity publication cover
OCTOBER 2025

Value Creation in Private Equity

A five-capability blueprint for value-creation alpha.

QR code for Value Creation in Private Equity
The M and A Dance publication cover
AUGUST 2025

The M&A Dance

How acquirers convert synergy plans into shareholder value.

QR code for The M and A Dance

Full catalogue: barnabyrobson.org/about/publications/

Thank you

← → to navigate