Hong Kong trades below New York, London and Shanghai
Its median P/E was 11.9× in 2025, against 15.2×–29.1× on the three other exchanges shown.
Median price-to-earnings ratio by stock exchange, 2019–2025
Source: Capital IQ; KPMG analysis. Exchange medians include companies with positive earnings.
Barnaby Robson -- September 2026
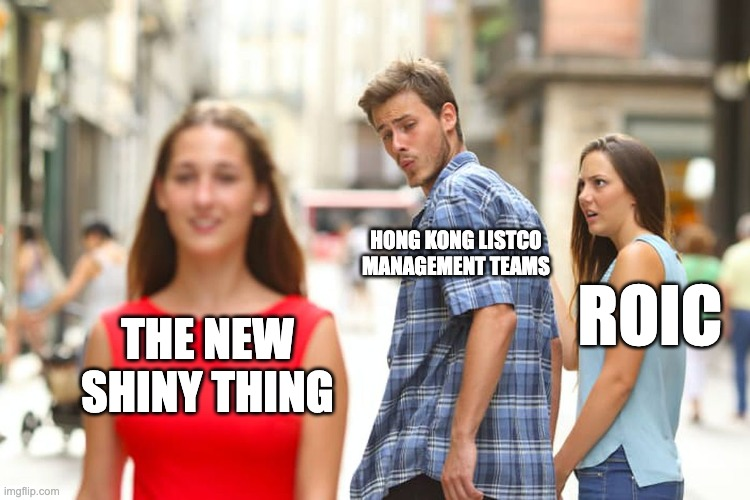
MICHAEL BURRY · CASSANDRA UNCHAINED
Hong Kong stocks are in the dumps.
“Hong Kong stocks are in the dumps, and have been there for some time. This was not always the case. I know, I was there in 2005.....
In October 2020, Jack Ma publicly bristled at perceived suppression of innovation in China. This offended Beijing. Within 10 days, Alibaba’s planned IPO of Ant Group was cancelled, and Beijing launched a two-year regulatory crackdown on China’s entire technology sector.
The peaking Hang Seng found no succor as the property market teetered into an epic descent, and COVID erupted from China and ran through China’s customers. Then came 3 years of lockdowns.....
These companies deserve a re-evaluation, a deep look into vulnerabilities, virtues, and value.”
Quote supplied by Barnaby Robson. Image: The Big Short (2015), supplied frame.
Economic profit is the clearest test of value creation
We tested whether Hong Kong’s discount reflected weak value creation.
ROIC and WACC apply to non-financial companies. Financial companies use ROE and cost of equity. Source: KPMG, Hong Kong - the capital allocator's market, August 2026.
Barnaby Robson -- September 2026
Economic profit turned negative in 2022 and stayed there
71% of HKEX companies earned less than their capital cost in 2025.
Aggregate economic profit, HKD bn, 2015–2025
Financial companies use return on equity and cost of equity. Source: Capital IQ; KPMG analysis.
Barnaby Robson -- September 2026
Capital grew more than twice as fast as profit
From 2015 to 2025, invested capital and equity grew 92%; profit grew 43%.
Capital and profit, indexed to 100 at 2015
Capital uses invested capital for non-financial companies and equity for financial companies. Source: Capital IQ; KPMG analysis.
Barnaby Robson -- September 2026
New capital earned 3.0 points below its cost
Across 2015–2025, the market earned 4.9% on new capital against a 7.9% cost.
Incremental return minus estimated capital cost
Incremental return approximates the change in profit divided by the change in capital, using 2015 and 2025 endpoints. Source: Capital IQ; KPMG analysis.
Barnaby Robson -- September 2026
The HSI held an 11% return as the long tail fell to 3.5%
Scale helps, although 26 of 93 Hang Seng Index constituents still destroyed value in 2025.
Return on invested capital, non-financial companies, 2015–2025
Aggregate ROIC of non-financial companies; HSI constituents versus the rest of HKEX. Source: Capital IQ; KPMG analysis.
Barnaby Robson -- September 2026
Six of eleven sectors destroyed value in 2025
Real Estate fell to −7.0 points while Communication Services reached +8.8 points.
Return minus capital cost, percentage points, 2020 to 2025
Financials use ROE minus cost of equity; other sectors use ROIC minus WACC. Source: Capital IQ; KPMG analysis.
Barnaby Robson -- September 2026
Twenty companies generated 55% of the value created by 657 firms
The top ten contributed 40%; the next ten added 15%.
Positive economic profit, 2025, HKD bn
Source: Capital IQ; KPMG analysis. The remaining 637 value creators contributed HKD923bn.
Barnaby Robson -- September 2026
ROIC reveals the operating model behind the return
For non-financials: ROIC = NOPAT margin × invested-capital turnover.
Two operating levers determine the return on capital
Financial companies use the ROE analogue. Source: Capital IQ; KPMG analysis.
Barnaby Robson -- September 2026
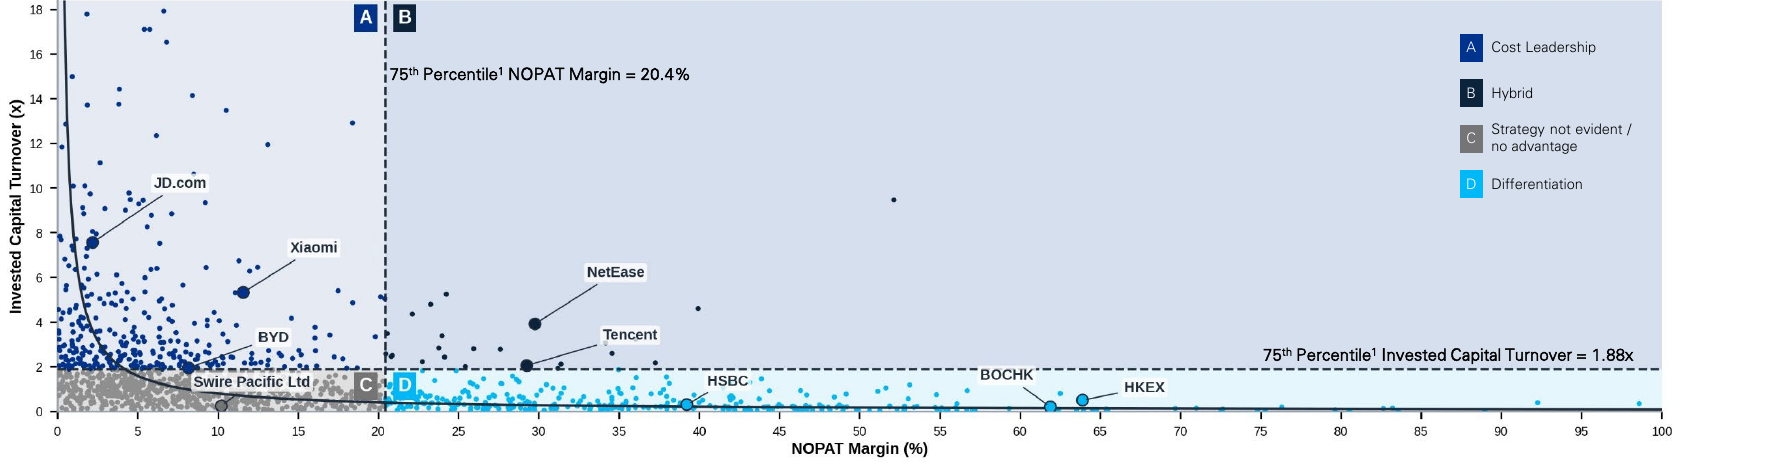
52% of profitable companies show no evident strategic advantage
52% sit below both strategy thresholds for margin and capital turnover.
2025 NOPAT margin versus invested-capital turnover
52%: no evident advantageThin margins and slow capital turnover.
Two routes to stronger returnsRaise margin, turn capital faster, or improve both.
Source: Capital IQ; KPMG analysis. Profit-making HKEX Main Board companies, 2025. Thresholds are the 75th percentiles: 20.4% margin and 1.88× turnover.
Barnaby Robson -- September 2026
The return spread determines the capital-allocation choice
Invest, restructure, divest or reallocate.
Capital-allocation decision matrix
Source: KPMG, Hong Kong - the capital allocator's market, August 2026.
Barnaby Robson -- September 2026
Large Hong Kong groups are making capital allocation explicit
Jardines, HSBC and Swire now publish return targets and explicit capital-reallocation actions.